
The Energy Tab
South Africa’s energy subsidies were at least ZAR 198 billion (USD 10.8 billion) in financial year (FY) 2025, with 55% from direct fossil fuel subsidies. Support for electricity, which covers most of the remaining quantified subsidies, also props up a coal-dominated power system. The values for renewable energy tax incentives are missing from the picture, as the claim amounts have not been published.
While often well-intentioned, fossil fuel subsidies can have unintended negative consequences. These subsidies are frequently a financial burden for governments, locking in sources of air pollution and emissions that contribute to climate change, crowding out cleaner alternatives, and being an inefficient way to help low-income households. Understanding energy subsidies and their costs can help improve energy polices to achieve the best social and environmental outcomes.
In 2009, as a member of the G20, South Africa committed to phase out and rationalize inefficient fossil fuel subsidies over the medium term, while providing targeted support for vulnerable groups. Following its hosting of the G20 in 2025, South Africa could show leadership by taking steps to reform its energy subsidies, as outlined below.
Key Recommendations
- South Africa should develop a comprehensive action plan for energy subsidy reform with local stakeholders.
- National government and Eskom should work together on a financial recovery plan for Eskom that aligns with a clear, agreed vision for its role in the South African Wholesale Energy Market.
- National government should improve the implementation, targeting, and allocations of the Free Basic Electricity policy.
- National government should support National Treasury to revise the design of the carbon tax, without undue corporate influence.
- National government should facilitate the design of targeted support for the transport needs of low-income households, while blanket liquid fuel subsidies are phased out.
- National Treasury should prioritize renewable energy subsidies during its process of expanding on tax expenditure reporting.
Overview of Energy Subsidies
Energy subsidies totalled at least ZAR 198 billion (USD 10.8 billion) in FY 2025. Most quantified subsidies support fossil fuels, but the picture is incomplete as the available data on the value of renewable energy subsidies is very limited (mainly tax incentives).
Subsidies directly for fossil fuel consumption tripled from FY 2018 to FY 2025. In real terms, these grew from ZAR 37 billion (USD 2.9 billion) in FY 2018 to an estimated ZAR 110 billion (USD 6 billion) in FY 2025. Several policies contributed to this increase. First, the carbon tax commenced in FY 2020, resulting in foregone revenue related to the energy sector exemptions from FY 2020 onward (FY 2025 = ZAR 57 billion/USD 3.1 billion). Second, the value of tax exemptions and refunds for purchasing petrol, diesel, and illuminating paraffin increased (FY 2025 = ZAR 41 billion/USD 2.2 billion). Third, in FY 2023, a freeze on the General Fuel Levy was introduced (FY 2025 = ZAR 4 billion/USD 0.2 billion). Therefore, a driver of increased direct fossil fuel subsidies since FY 2018 has been the introduction of additional measures.
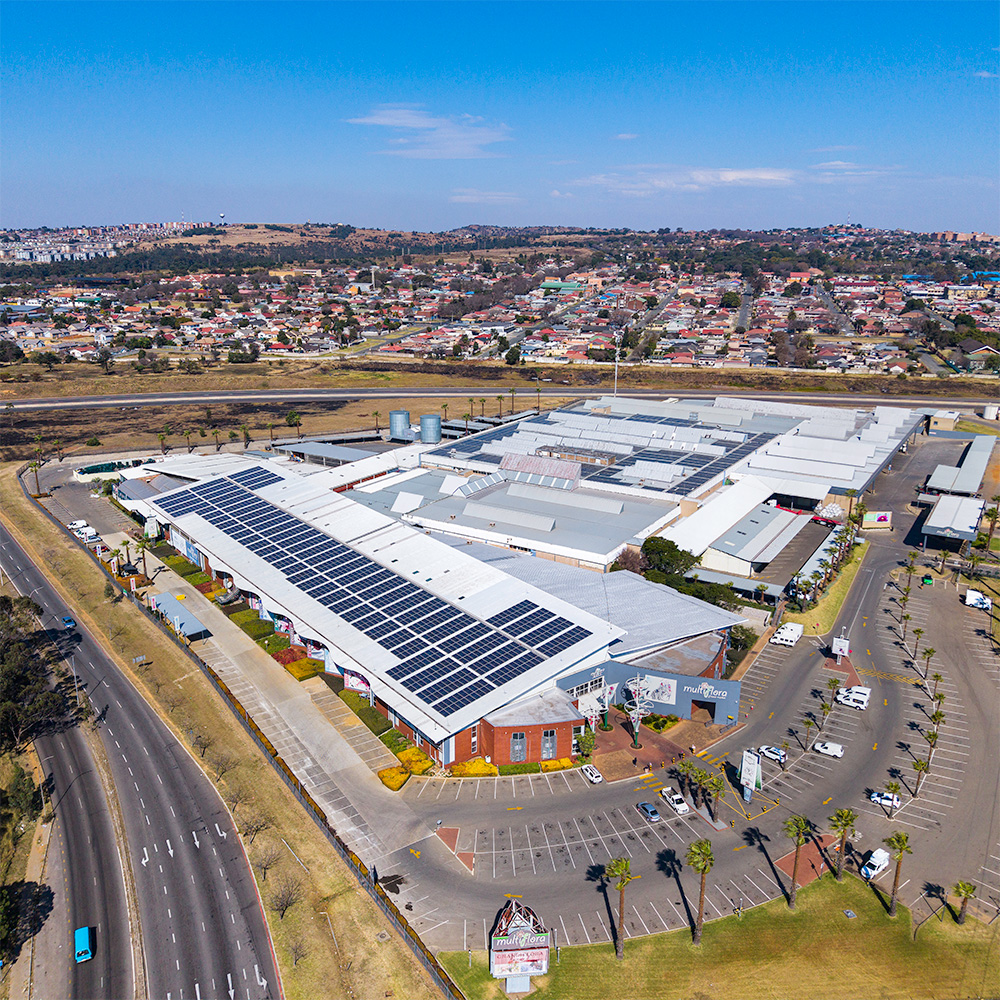
Electricity subsidies support a fossil fuel-dominated power system and increased more than fourfold from FY 2018 to FY 2025. In real terms, these escalated from ZAR 21 billion (USD 1.6 billion) in FY 2018 to ZAR 87 billion (USD 4.8 billion) in FY 2025, mainly due to bailouts for the state-owned power company, Eskom. Historically, most electricity in South Africa has come from coal power stations, and 83% of national electricity generation still came from fossil fuels in 2024. This placed South Africa’s electricity generation as the 12th most carbon intensive in the world. As renewable energy supply increases, the link between electricity subsidies and fossil fuel support will decrease. However, subsidies that support the existing asset base may delay the rollout of renewables.
In theory, these electricity subsidies are technology neutral and were introduced for specific socio-economic reasons: provide free basic energy services, expand electricity access, improve energy efficiency, and support Eskom. As such, they differ from the liquid fuel subsidies and carbon tax exemptions, which aim to reduce the financial impact of using fossil fuels.
Recommendation
South Africa should collaboratively develop a comprehensive action plan for energy subsidy reform with local stakeholders.
It should cover direct fossil fuel subsidies and electricity subsidies and align with just transition frameworks. As advised for all G20 countries, the plan should have concrete deadlines and detailed implementation steps. The prioritization and timelines for subsidy reform should be informed by an assessment of the social and economic impacts. Remaining subsidies need to have a clear rationale, such as supporting highly vulnerable populations. Where appropriate, subsidies can be targeted or shifted to low-carbon energy carriers that achieve the same objective.
Scope and Definitions
We estimate national-level energy subsidies in South Africa using publicly available data from government FY 2018, with new data for FY 2024 and 2025. The digital story covers high-level results, brief discussion, and recommendations. The Annex provides tables of values, descriptions of policies, explanations of calculations, and references.
Subsidies are financial contributions by a government or other public body that confer a benefit (Agreement on Subsidies and Countervailing Measures under the World Trade Organization). The main types are
- direct and indirect transfers of government funds and liabilities (national budget outlays)
- government revenue foregone (through reduced tax rates and tax exemptions)
- provision of goods or services below market value
- income and price support through market regulations
This definition is purely to identify if a measure can be counted as a subsidy: it does not make any judgment on whether the subsidy is inefficient or if it should be reformed.
We focus on the first two types, and we cover only subsidies provided by the national government. We do include when municipalities are intermediaries for national subsidy instruments.
Some unquantified subsidies are included. For renewable energy, there are important tax benefits, but the data on what has been claimed is not publicly available.
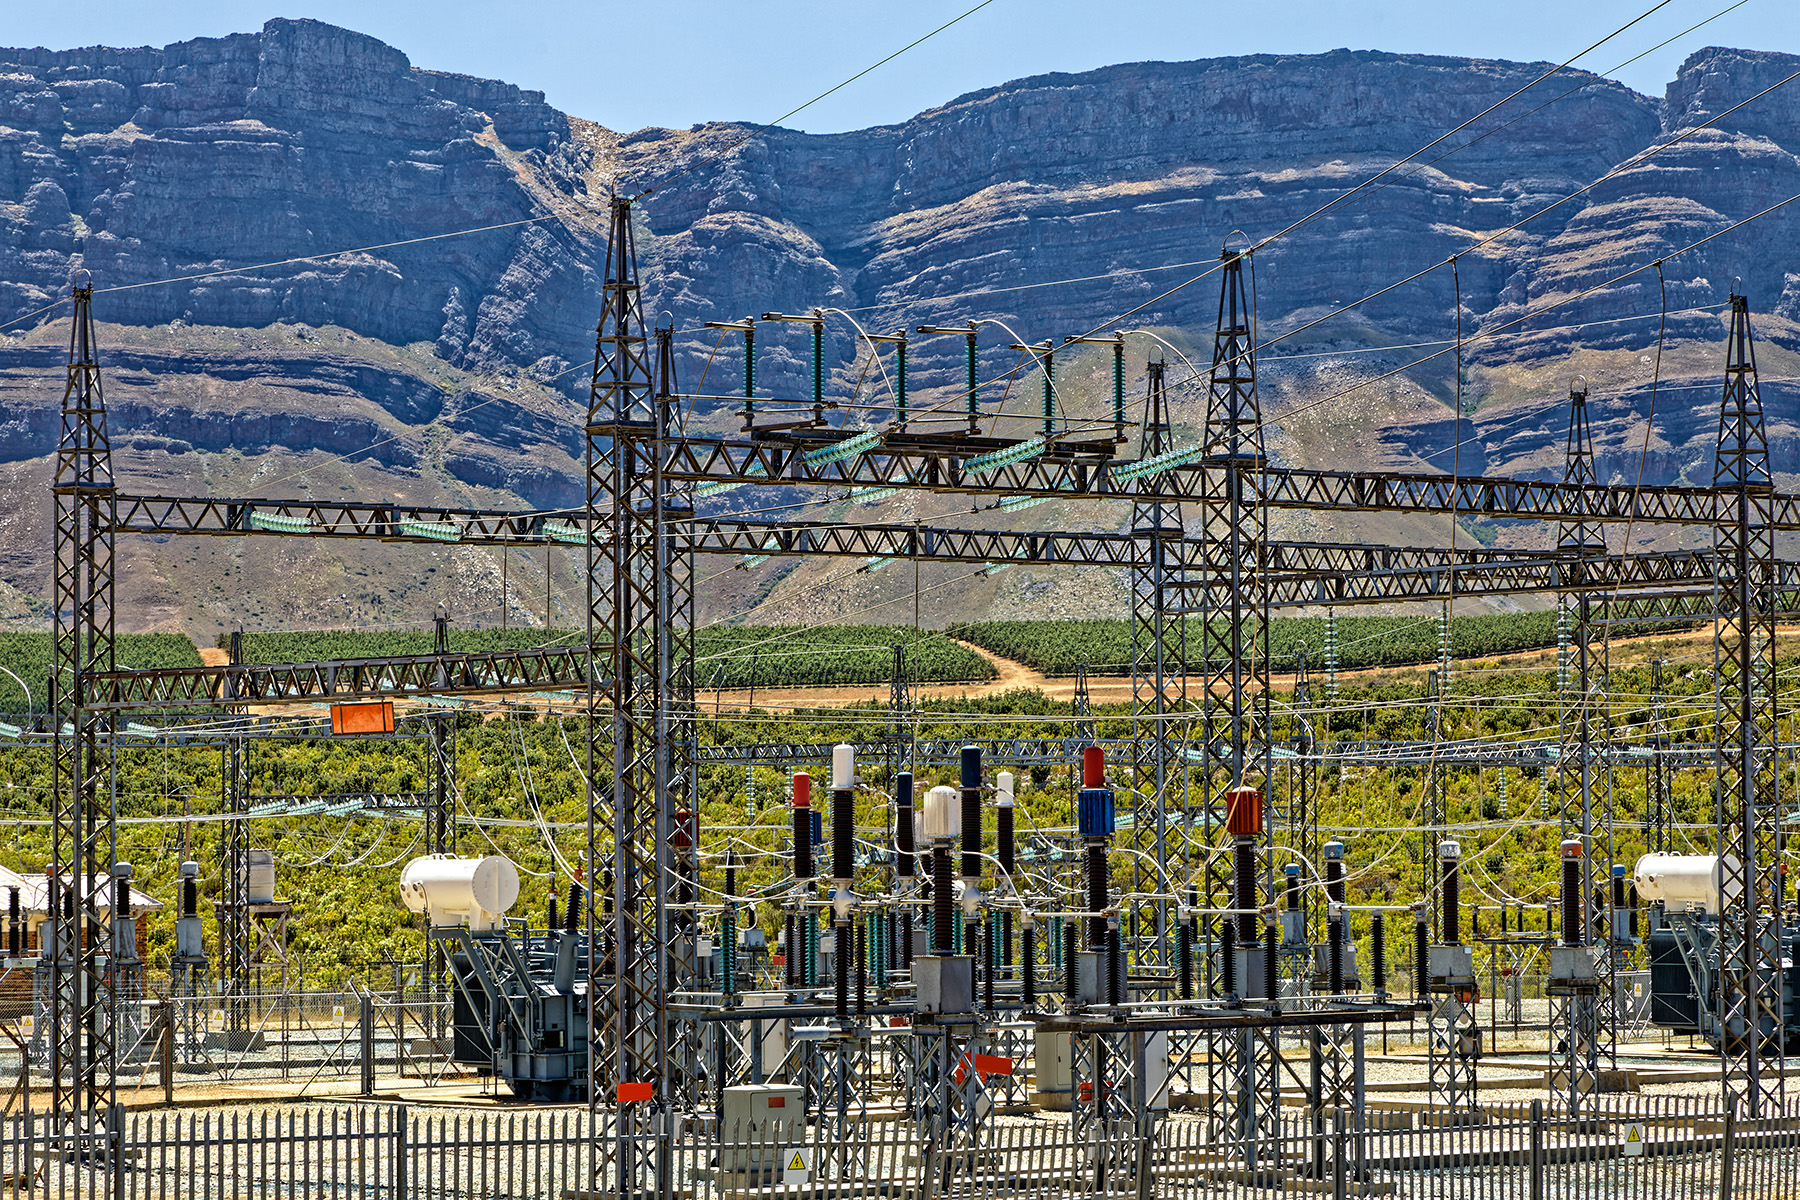
Power Sector
Since FY 2020, over 70% of nominal electricity subsidies have been to help Eskom deal with debt, rather than directly improving the affordability or supply of electricity. Over 40% of quantified energy subsidies in FY 2025 were for electricity, with the bailouts to Eskom being by far the largest. The bailouts vary significantly year-on-year, and are set to continue, with ZAR 80.2 billion (USD 4.4 billion) allocated for FY 2026. In nominal terms, Eskom received ZAR 299 billion (USD 17.8 billion) from government between FY 2020 and FY 2025, which was over 2.5 times the total of ZAR 113 billion (USD 6.9 billion) for all other electricity subsidies combined.
Three other long-standing electricity subsidies are: a) allocations to supply free basic energy services, mainly via electricity, b) grants to the Integrated National Electrification Programme (INEP), which expands electricity access through infrastructure projects, and c) energy efficiency and demand side management grants for municipalities.
The allocation for free basic energy increased 21% in nominal terms from FY 2024 to 2025. In FY 2025, the total INEP grant decreased by almost 30% from FY 2024 in nominal terms, as funds were channelled to a new Smart Meters Grant introduced in FY 2025 at ZAR 500 million (USD 26 million). In real terms, energy efficiency support has decreased by 16% comparing FY 2018 to FY 2025.
Recommendation
National government should create a space to develop a clear vision on Eskom’s future role in the South African Wholesale Energy Market, with buy-in from all key stakeholders.
The bailouts are the result of a system that is not working. Until the contributing factors to Eskom’s financial distress are resolved, bailouts will be required. But solutions must now be found in the context of an evolving power market and Eskom’s unbundling. While some of this has happened on paper, pushback from vested interests in the legacy Eskom systems is delaying progress.
National government and Eskom should work together on a financial recovery plan that aligns with such a vision and can be implemented without obstruction from vested interests.
This plan should include details on how to improve Eskom’s operational and financial position in its new role, address residual governance issues, and allow for a reduction in conditional and time-limited fiscal support over time. It should address improved revenue collection and collaboration with the energy regulator on a long-term, predictable path for electricity tariffs.
These efforts should allow the government to reduce Eskom’s debt-related bailouts and guarantees over time.

Free Basic Electricity
In the decade from 2015 to 2025, Eskom’s average electricity tariff has increased almost three times the rate of inflation (177% versus 60%), so households are under increasing pressure to pay for electricity. The grant for free basic energy services is intended to provide households below the poverty threshold with 50 kWh of free electricity per month (or equivalent fuel if there is no grid connection). The government allocations made to municipalities for this purpose have increased from FY 2018 by 51% (in real terms) to reach ZAR 18.3 billion (USD 1 billion) in FY 2025. The government determines the grant value per year based on the estimated cost to supply the electricity allowance to the determined number of households. So, the above-inflation increases in the subsidy are mainly due to the above-inflation rise in electricity prices, rather than an increase in the amount of service to be provided.
Main concerns around this subsidy are as follows:
- It is widely recognized that 50 kWh per month per household is insufficient for basic energy needs, particularly when low-income households have more than one family on the same property or are sharing an electricity meter. The rate has not increased since 2003 when the policy was introduced. However, recent analyses on what it should be range from 100 kWh to 350 kWh/month, depending on assumptions, feasibility, and developmental definition of basic service.
- Analysis has shown that municipalities’ total expenditure on free basic electricity provision has been significantly less than the amount they received from the government. This could be a financial incentive for municipalities to make it difficult for households to claim their free basic electricity (FBE). In 2025, Eskom said that 8 million eligible households (of 10 million total) are still not receiving their FBE. This implies that only 20% of the funding provided to municipalities for FBE is actually being used for its intended purpose. So, in FY 2025, about ZAR 14.6 billion (USD 0.8 billion) for indigent household energy provision is being used elsewhere by municipalities.
- FBE funding goes to municipalities, but Eskom directly supplies a large proportion of indigent households, resulting in settlement issues. Some households get missed by Eskom and municipalities.
- Other limitations of FBE include the way different municipalities determine eligibility, the complexity of the registration process, penalties for electricity consumption rates, restriction of FBE to municipal account holders, and insufficient oversight.
Recommendation
National government should prioritize processes to improve FBE implementation and redesign of the policy.
Most vulnerable households do not currently receive FBE, so the targeting and accountability should be improved (some processes are underway) before increasing the allowance. Future revision will need to be coupled with innovative methods for financing a higher allowance, as the national budget is already strained.
Features the government should include, building on work in progress:
- equitable criteria for eligibility across different municipalities, noting local context;
- making registration and use of the service easy for recipients;
- linking FBE beneficiaries to the prepaid meter data to prevent leakage;
- strict oversight so that the funds are used for their intended purpose;
- transparent reporting on municipal use of FBE grants;
- robust settlement system in Eskom supply areas;
- a new kWh/month allocation based on a fair per-person requirement for basic energy services;
- targeting using the number of beneficiaries, not simply per electricity meter.

Carbon Tax Exemptions
Our estimate of the energy sector carbon tax exemptions was ZAR 57.2 billion (USD 3.1 billion) in FY 2025. The carbon tax is the primary mitigation policy instrument in South Africa for greenhouse gas emissions. However, during the extended Phase 1 of the tax from 2019 to the end of 2025, the threshold levels and allowances mean that most emissions are not taxed. Since the tax was introduced, the rules have remained the same, so the increase in the exemption value is mainly due to the yearly increase in the headline carbon tax rate in ZAR per tonne of carbon dioxide equivalent (tCO2e).
Main concerns with Phase 1 of the carbon tax:
- The carbon tax is, in theory, linked to the “polluter pays” principle, and should contribute to covering the estimated cost of the damage to society (the social cost of carbon). In 2025, the headline carbon tax rate (i.e., the rate before any allowances are applied) in South Africa was ZAR 236 (USD 12.6)/tCO2e. This is a quarter of one of the lowest international policy-relevant social cost of carbon values of USD 51/tCO2, and is only a twentieth of a reweighted mean estimate of USD 283/tCO2 from a comprehensive 2024 analysis of 147 social cost of carbon studies.
- With many entities getting over a 90% exemption, the effective carbon tax rate (i.e., the rate that is actually paid) is much lower than the headline rate. Based on revenue collection, the International Monetary Fund estimated the average effective carbon tax rate to be only ZAR 7 (USD 0.47)/tCO2 in FY 2022. This is far too low to be an effective driver of behaviour change.
- Research published in 2025 shows the significant extent to which corporate lobbying and industry pressure have delayed and compromised the effectiveness of the carbon tax.
The proposed Phase 2 of the carbon tax from 2026 should progressively reduce allowances and increase the tax rates. However, it maintains most of the allowances from Phase 1, and thus perpetuates the same concerns until the end of 2030, including a mechanism to keep the carbon tax on electricity generation revenue neutral. Analysis indicates that Eskom will not pay more tax in Phase 2 than it did in Phase 1 via an environmental levy.
Recommendations
National government should support National Treasury to revise the design of the carbon tax, taking steps to constrain the potential for outsized corporate influence.
A phased approach makes sense, but it must still result in an effective rate that drives change in behaviour and business operations to meaningfully reduce emissions in the short term. By 2035, at the latest, the headline rate should increase to an agreed fair reflection of the social cost of carbon, and without exemptions. Revenue from the carbon tax could be ringfenced to support other initiatives.
National Treasury can consider further research on how other countries have introduced carbon pricing into a financially constrained electricity sector.
This may help identify additional solutions for how carbon pricing can be an effective incentive for Eskom, despite its constrained financial position, and does not unfairly erode consumer affordability. For example, the European Union Emissions Trading System has eventually shown positive results in reducing emissions, after several phases, but work would be required to see if such a mechanism is feasible and desirable in the South African context.
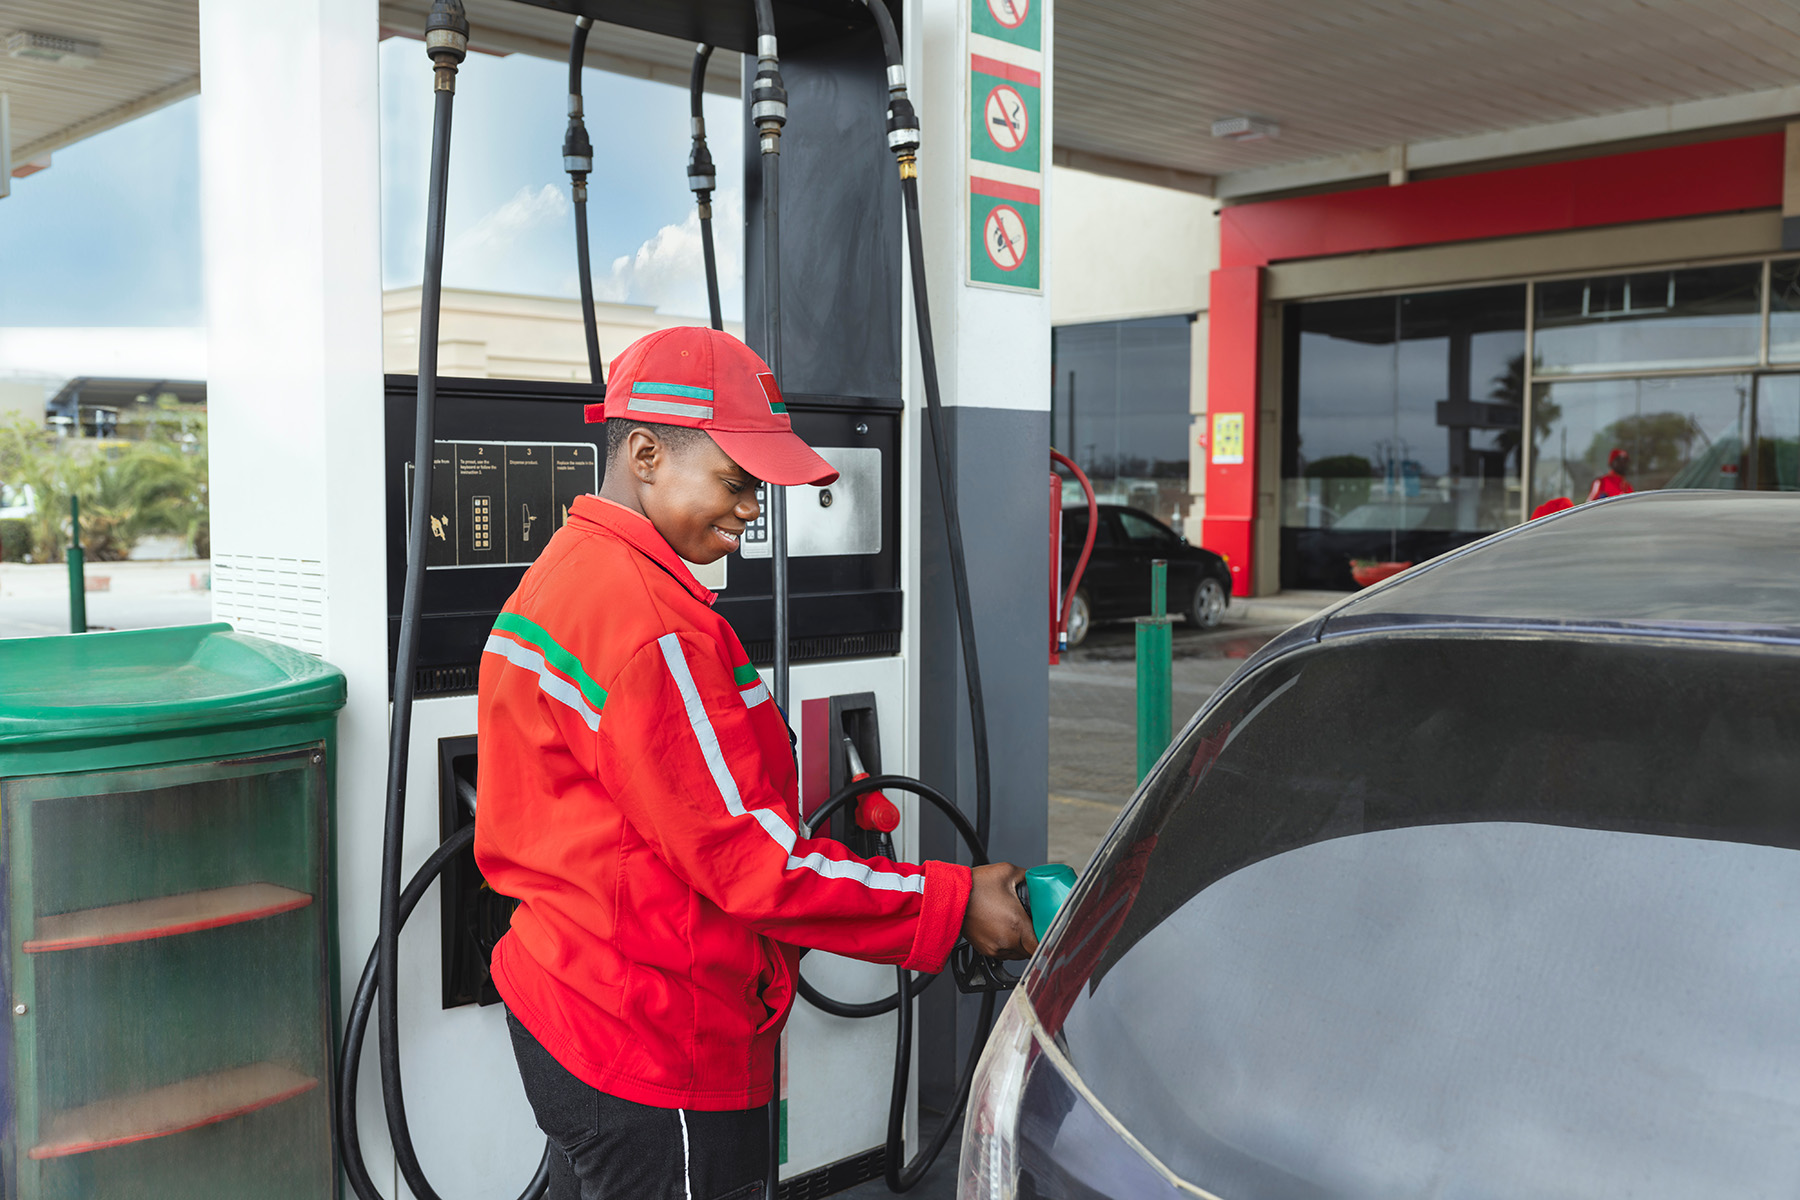
Liquid Fuels
The three main liquid fuel consumption subsidies are untargeted, so the largest monetary benefit goes to the largest fuel consumers. About 60% of final liquid fuel consumption is for transport.
- The value-added tax zero-rating for sales of petrol, diesel, and illuminating paraffin has been more than 70% of the value of liquid fuel subsidies since FY 2018. With the drop in sales and price during the COVID-19 lockdown restrictions, the total revenue foregone to government decreased in FY 2021.
- The diesel refund amounts (for fuel levy and road accident levy on diesel used in specific primary production sectors) have been more or less static in nominal terms since FY 2020, declining slightly in real FY 2025 terms.
- In FY 2022, a reduction in the General Fuel Levy was introduced for 4 months, which resulted in a spike in government revenue foregone in FY 2023. This mirrored actions in many parts of the world to shield consumers from liquid fuel price increases in response to the energy price crisis caused by Russia’s invasion of Ukraine. Once the levy returned to the amount it was at the start of FY 2022 (given as a ZAR/litre of fuel type), it was “frozen” until FY 2025. An inflation-linked increase was announced for FY 2026, which will end the subsidy if implemented.
At the intersection of energy and transport, the subsidy landscape is very much in favour of liquid fuels compared to electric vehicles. In the national budget for FY 2024, an electric vehicle tax incentive was tabled for FY 2027, but this is predicted to reduce tax revenue by just ZAR 500 million in that year, which is only 2% of the zero-rating of VAT on petrol sales reported for FY 2023.
Recommendation
National government should facilitate the design of targeted support for the transport needs of low-income households, while blanket liquid fuel subsidies are phased out.
Identifying the optimal mechanism (e.g., targeted cash transfers) will require research and collaboration with the intended beneficiary groups. This can be coupled with improved support for public transport in low-income areas and incentives to increase the electrification of transport. Between FY 2018 and FY 2025, the price of petrol and diesel has risen by more than 1.5 times the rate of inflation, so reducing the existing subsidies will likely face significant social pushback in the absence of suitable alternatives.

Renewables and Storage
There have been subsidies linked to renewable energy since 2008, with a subset applicable to energy storage (see Annex). Within our scope, we could not identify any current subsidies that are specific for energy storage only. Important renewable energy incentives are sections within the Income Tax Act. Some are only for renewable energy projects (e.g., 12B and 12U) and others are general tax incentives that renewable energy projects can qualify for (e.g., 11D).
National Treasury has published the results of a survey on renewable energy tax incentives. However, there is minimal data in the public domain on their values. For example, 12B has been available since 2009 for qualifying renewable energy projects to claim a tax deduction on certain capital costs. However, National Treasury and the South African Revenue Service (SARS) have not yet published the value of the 12B claims. In 2023, this incentive was expanded for 2 years (12BA) to encourage more investment in renewable energy. National Treasury indicated that the potential impact during the first year of 12BA would be a ZAR 5 billion (USD 0.27 billion) reduction in government revenue. But a figure has not been published for the second year.
Accurate quantification would require collaboration with National Treasury and SARS. Estimating the value of these tax incentives using measures like installed capacity is problematic and error prone. For 12B again, the tax deduction is based on project costs, which is commercially sensitive information. If this were approximated using industry data on average capacity costs, then it is unknown which projects qualify. Many projects under the Renewable Energy Independent Power Producer Procurement Programme are financed under special tax treaties and are not eligible to claim 12B.
Recommendations
National Treasury should prioritize renewable energy subsidies during its process of expanding on tax expenditure reporting.
Greater transparency on the value of renewable energy and storage subsidies will facilitate a more balanced discussion on overall energy subsidies.
SARS should publish disaggregated values for renewable energy tax codes like Section 12B and 12U.
For codes like Section 11D, a breakdown to the level of renewables would be helpful. While taxpayer information is confidential, collecting project-level data and publishing disaggregated, national-level results could be done without revealing any company or individual details.
Download Annex
You might also be interested in
South African Fossil Fuel Subsidies Hit Record Highs as Country's Energy Crisis Deepens
South Africa's fossil fuel subsidies tripled between 2018 and 2023, hitting USD 7.5 billion, up from USD 2.9 billion 5 years earlier, a new report by IISD reveals.
Bonn Climate Talks: What to watch for the fossil fuel transition
As governments return to Bonn for the UNFCCC Subsidiary Bodies meetings (SB64), the transition away from fossil fuels will be a key test of whether growing political momentum can translate into practical progress.
Bonn Climate Talks 2026: What to expect after Santa Marta
With UN climate talks starting in Bonn soon, the shift to implementation is being felt, especially in the transition away from fossil fuels.
India’s State Energy Firms can Boost Energy Security by Progressively Shifting Over INR 2 Trillion Per Year From Fossil Fuels to Clean Energy
New research finds India’s nine state-owned energy companies could progressively redirect a significant share of their over INR 2 trillion annual capital expenditure toward clean and reliable energy, strengthening energy security while accelerating the low-carbon transition.