
Why Canada Needs to Plan for a Steep Decline in Global Oil Demand
The Bottom Line: Unpacking the future of Canada's oil & gas
Re-Energizing Canada is a multi-year IISD research project envisioning Canada's future beyond oil and gas. This policy brief is part two of The Bottom Line series, which digs into the complex questions that will shape Canada's place in future energy markets. (Download PDF)
Summary
- International Energy Agency scenarios project a decline in oil demand globally as climate policies intensify.
- Canada’s own energy body, the Canada Energy Regulator, shows a projected decline in Canadian production.
- Decline in oil demand is driven primarily by road transport, the largest component of crude oil demand at 44%, with the electrification of passenger vehicles especially leading the way.
- Other end uses for oil will reduce demand post-2030 or earlier under aggressive policy scenarios.
- Trends suggest global demand for oil will be in decline by 2030 and will drop significantly thereafter.
What is the future of global demand for oil? This is a critically important question for Canada as the global energy transition gains momentum, and governments establish policies to limit greenhouse gas (GHG) emissions, support economic stability, and promote energy security. To limit warming to 1.5°C, the world’s economy must quickly move away from fossil fuel consumption and reduce demand significantly, and trends in policies and technologies suggest this transition is already underway. This means that Canada, as a major oil exporter, will have to contend with a shrinking global market post-2030.
This brief will make the case for a near future with much less global demand for oil. Future briefs in this series will explore what this means specifically for Canadian producers.

Climate Action Continues to Build Momentum That Is Reflected in Future Oil Demand Scenarios
To understand potential future demand for oil, it is useful to consider both international and domestic analyses. Two influential analyses of possible futures for oil are annually delivered by the International Energy Agency (IEA) and the Canada Energy Regulator (CER). While only these two outlooks are discussed in this brief, as the most relevant and authoritative, they are in line with the many other credible analyses that predict a peak of global oil demand by 2030 or earlier.
The IEA’s World Energy Outlook 2021 describes three scenarios for the future of global oil demand and production:
- Stated Policies Scenario (STEPS)—A low climate-ambition scenario that assumes only current energy-related climate policies and those in progress will be adopted between now and 2050, with no ratcheting up of plans or targets.
- Announced Pledges Scenario (APS)—This scenario assumes the energy-related climate targets made by governments as of 2021 are achieved by 2050, even if policies to achieve these targets are not yet in place.
- Net-Zero (NZE)—A more ambitious scenario where the global energy sector reaches net-zero GHG emissions by 2050, via a hypothetical set of government policies and behavioural changes. This is the only IEA scenario that is consistent with limiting global warming to 1.5°C.
Figure 1. WEO 2021 global oil demand
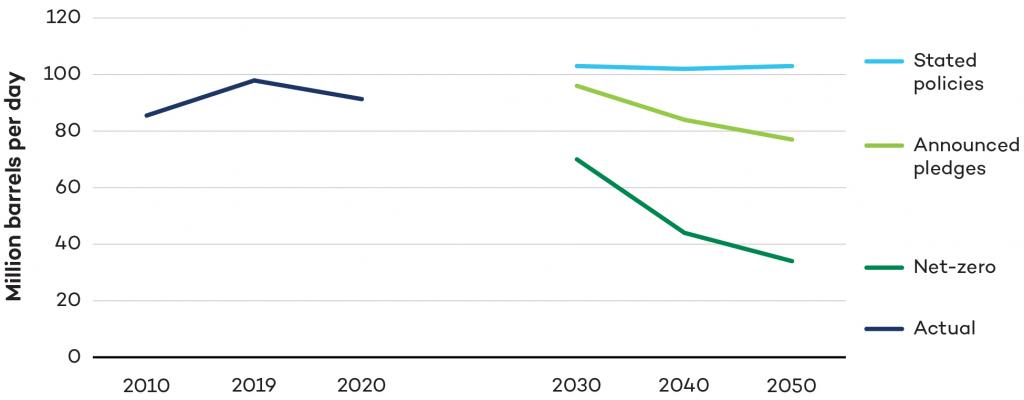
As shown in Figure 1, in the STEPS, demand for oil rebounds in the near term to pre-COVID levels, increases slightly out to the 2030s, and stays more or less stable at 103 million barrels per day (mbpd) to 2050. By contrast, in the APS, demand peaks around 2025 and falls by 1 mbpd per year between 2030 and 2050. In the NZE, oil demand has already peaked. It falls to 70 mbpd by 2030 and by 2.4 mbpd (or 5.3%) per year thereafter to 2050.
The CER’s Canada’s Energy Future 2021 also produces scenarios on the future of oil, but these are different from the IEA scenarios; they describe future production of Canadian oil given projected oil prices rather than future demand. They are not based on the same depth of global policy and technology analysis that is used by the IEA. At present, the CER does not model a scenario that is consistent with limiting global warming to 1.5°C. In 2021, the CER modelled two scenarios that cover Canadian crude oil production:
- Current Policies Scenario—This scenario assumes future energy-related climate policy remains unchanged from what is in place at the time of modelling. There is some technological improvement in mature technologies but limited uptake.
- Evolving Policies Scenario—This scenario assumes global energy-related climate policies are expanded at the same pace as they have been in recent years. Policies in development are adopted, and existing policies are somewhat strengthened over time. This scenario assumes technological innovation and uptake.
In the Current Policies Scenario, as shown in Figure 2, Canadian crude oil production is projected to rise until 2043 before falling slightly out to 2050. In the Evolving Policies Scenario, production climbs from pre-pandemic levels by 19% to peak in 2032, falling thereafter by an average annual rate of 1.1%, to reach roughly 2018 levels by 2050.
Figure 2. Total crude oil production – CER 2021
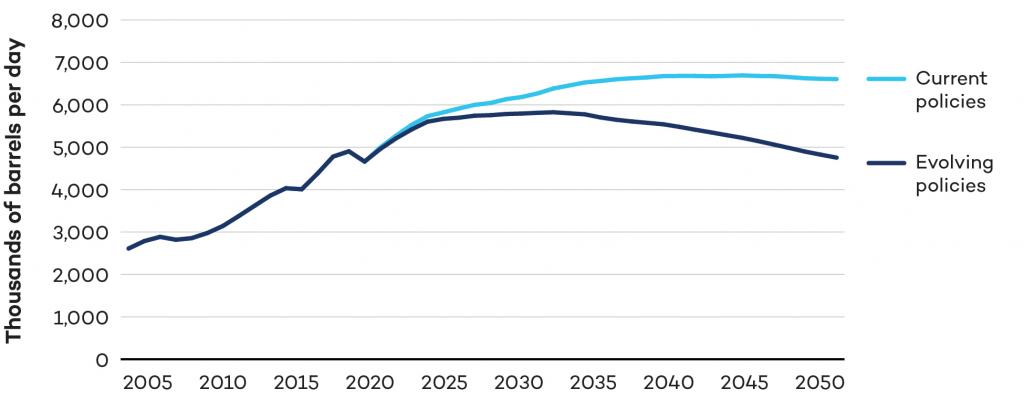
In the analysis that follows, the CER scenarios are not used as a basis for demand forecast; as noted above, that is not what they are intended for. They are shown here to illustrate that even under the CER’s relatively unambitious Evolving Policies Scenario assumptions, oil production in Canada will peak shortly after 2030.
Implications of IEA and CER Scenarios
The various scenarios from the IEA and CER paint very different pictures of the future, with corresponding implications for climate change outcomes and the Canadian oil and gas sector. To plan for economic resilience, it is paramount to assess which of those pictures is most likely.
Figure 3. Global GDP covered by NZ laws/policies/pledges
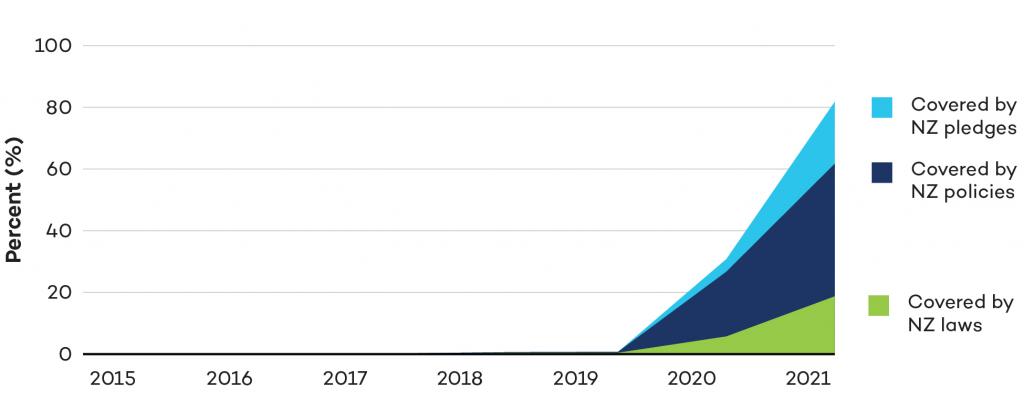
Figure 4. Global emissions covered by NZ laws/policies/pledges
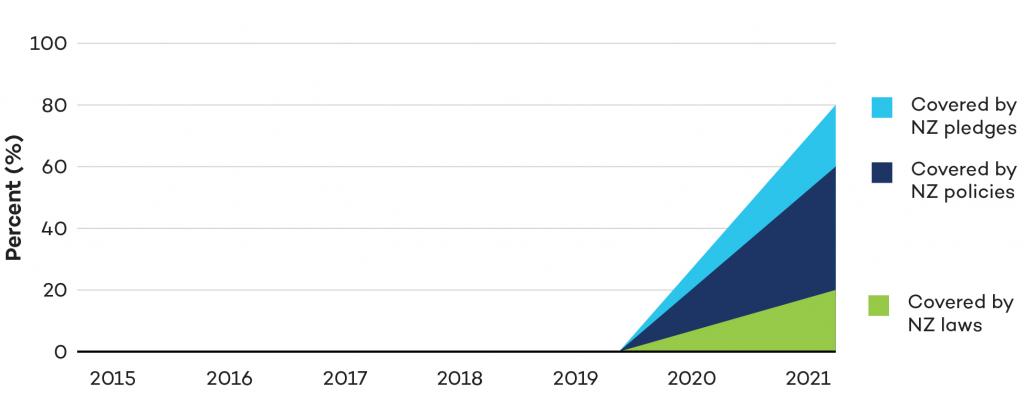
Some scenarios are easily eliminated. The IEA’s STEPS and the CER’s Current Policies Scenario both assume no evolution of existing or in-process climate policies from those that exist today out to 2050. That is so unlikely as to be effectively impossible. Since 2019, there has been a significant increase in national commitments to achieve net-zero GHG emissions. Figures 3 and 4 show a sharp increase in demonstrated commitments to stronger climate policy, with an increasing number of countries—including Canada—putting those commitments into law.
There are three drivers fuelling the trend of strengthened climate policies:
- Increasing certainty of the science of climate change and necessity to align with 1.5°C scenarios, and growth in public acceptance of that science.
- More frequent and powerful physical impacts of climate change the world over, such as heat waves, floods, storm surges, droughts, and wildfires. Compare the last 20 years with the 20 years previous: climate-related disasters (6,681 vs. 3,656); major recorded disaster events (7,348 vs. 4,212); people affected (4.2 billion vs 3.25 billion); and global economic losses (USD 2.97 trillion vs. USD 1.63 trillion). These occurrences also augment public acceptance of the science.
- As a result of both those drivers, growing pressure on governments to take action to mitigate climate change.
As atmospheric concentrations of GHGs grow, these drivers will only strengthen. The inevitable policy response means that the only plausible scenarios are those that show either a near-term peak in global oil demand (IEA APS, NZE) or that show Canadian production peaking in 2032 (CER Evolving Policies).
Trends Show Declining Demand for Oil
There is still variability in the remaining scenarios, driven by different assumptions about technology uptake and government policy responses to climate change. To assess the likelihood of the remaining scenarios, it is instructive to consider the major end uses for crude oil and the policies, trends, and technologies that are likely to affect each of them. We examine each in turn below.
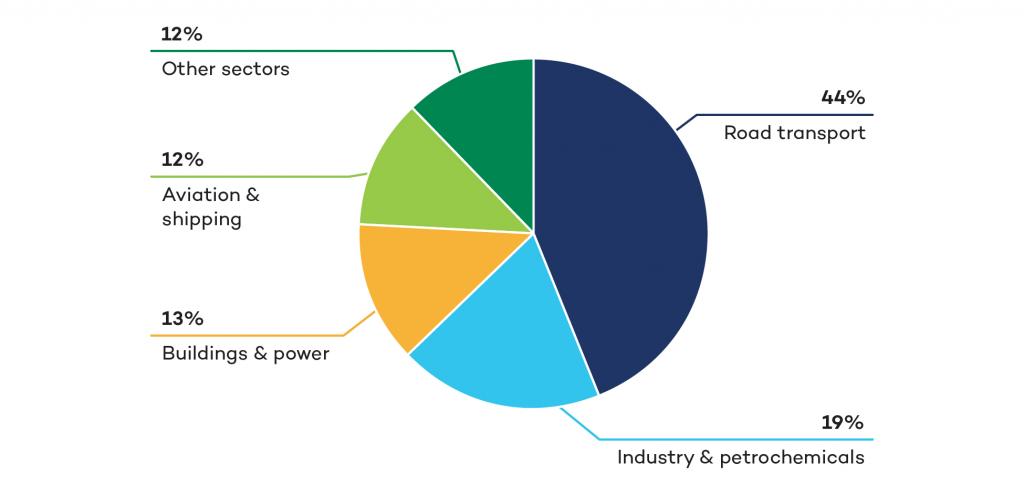
Road Transport
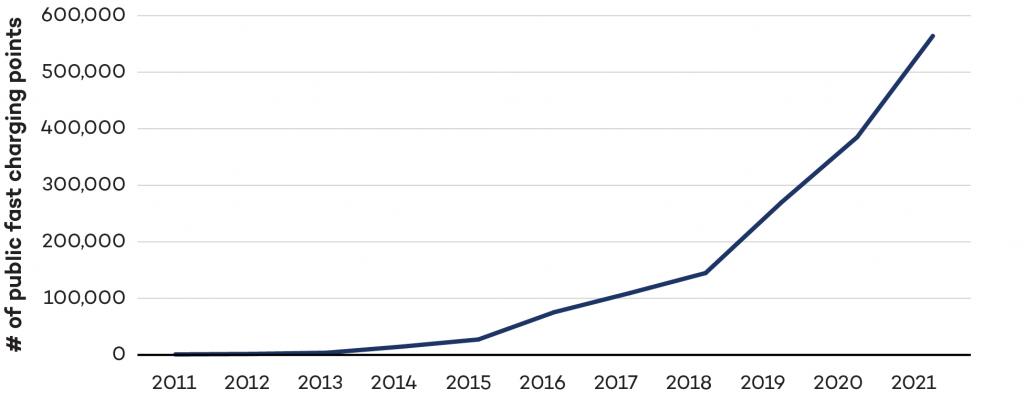
Road transport represents the largest share of demand for crude oil, at 44% (Figure 5) with the pace of transport electrification the most significant factor in determining future demand for oil. Figures 6 to 9 show that the electrification trend in the transport sector is gathering pace with electric vehicle (EV) sales, deployment of charging infrastructure, and battery range (as a proxy for technological development) all showing accelerating trends. In the case of passenger cars, it is easy to envision that in the next decade there will be a sharply reduced market for internal combustion engine vehicles.
The steep rate of change is being driven by evolving government policy. Governments covering 25% of the global market have announced 100% EV sales mandates for 2035, and EV-related subsidies doubled in 2021 to nearly USD 30 billion. These kinds of policies are low-hanging policy fruit for the many governments looking for ways to address climate change. They can be combined with popular industrial subsidies aimed at fostering competitive firms in the green markets of the future and employment-creating spending on charging infrastructure.
Figure 5. Global demand for oil
As a result, consumer uptake is poised to hit significant tipping points well before 2035, triggered by several factors, including the increasing affordability of electric vehicles. Under most assumptions, EVs are already cheaper on a lifetime basis or even straight off the lot if financed. Upfront cost parity is expected to come in the mid-2020s. Increasing range, the availability of infrastructure, and growing consumer confidence that comes from familiarity with the technology will also drive EV uptake.
According to Bloomberg NEF, “The market is shifting from being driven primarily by policy, to one where organic consumer demand is the most important factor. As regulatory drivers begin to play less of a role, consumer adoption dynamics—the ‘S-curve’—take over”. The S-curve describes the uptake of new technology that eventually takes off not in a linear fashion but exponentially, with sudden and overwhelming effects (Foster, 1986). There are numerous examples of such a dynamic with past technologies, including cellphones, personal computers and, ironically, internal combustion engine passenger vehicles.
Another driver of S-curve adoption rates will be the reluctance of new car buyers to purchase a conventional vehicle that they see as having low resale value—a positive feedback effect that will intensify as the market share of EVs climbs. EVs may also play an outsized role in the destruction of demand for oil well beyond their market share. Fleet owners, taxis, and ride-hailing services will be early adopters of EVs, given lifetime cost considerations, and their vehicles are driven many more kilometres than the average. Owners of multiple vehicles will likely also prefer to use the EVs over conventional vehicles if they have a choice, given the significant difference in operating costs.
To be on track with the IEA’s Net-Zero scenario, 64% of passenger car sales and 5% of truck sales would have to be electric by 2030. The above trends suggest that this trajectory is within range.
The outlook for uptake in heavy-duty vehicles (HDVs) is not as straightforward, as there would need to be large investments in highway charging infrastructure. However, policy and technological developments for HDVs have been accelerating, with China as an important early adopter. EVs for medium-duty trucks on urban duty cycles as commercial vehicles are already the cheapest option for many users, and face few infrastructure challenges.
Figure 6. Global EV sales (Light-Duty Vehicles)
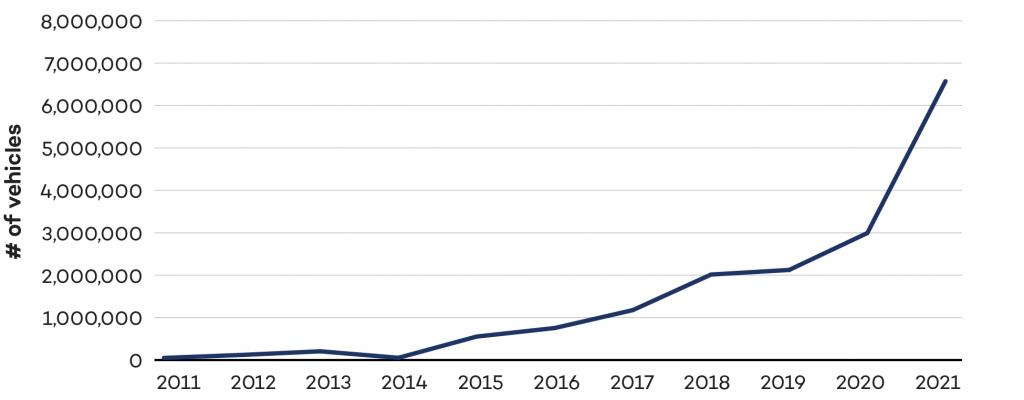
Figure 7. Global EV sales share (Light-Duty Vehicles)
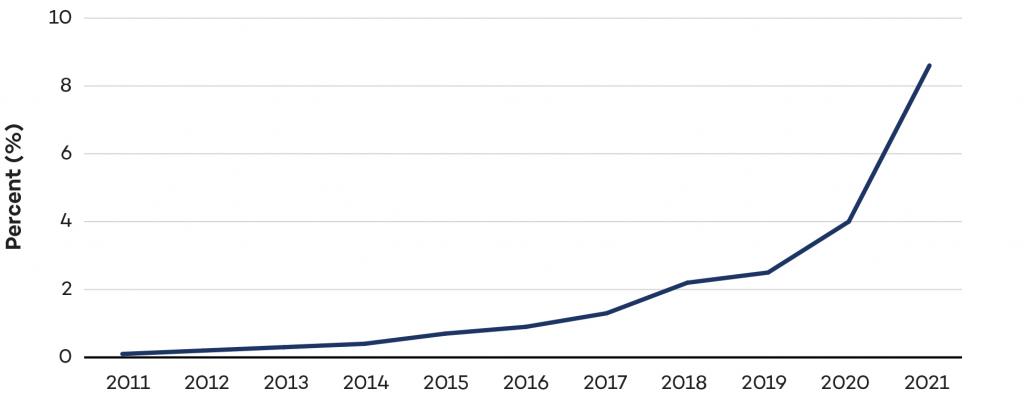
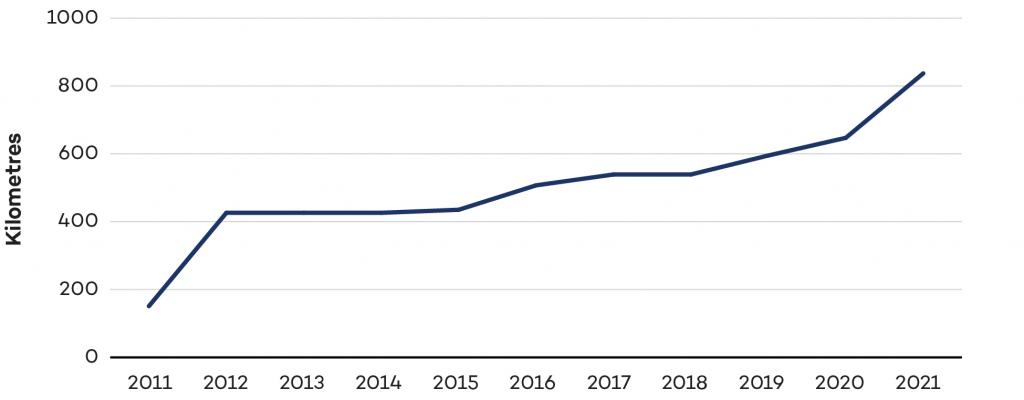
Figure 8. Global EV public fast charging points
From the perspective of road transport—the biggest factor in oil demand—the trends are tracking toward the IEA’s Net-Zero scenario. This would mean a significant displacement of oil demand beginning before 2030 and picking up pace as the share of electric vehicles grows exponentially. Compared to the business-as-usual Stated Policies scenario, the Net-Zero Scenario implies a drop in the demand for oil needed for road transport of 18.8 mbpd by 2030 and 49.9 mbpd by 2050.
Figure 9. Maximum range (U.S. EV models)
Plastics
Industry and petrochemicals make up the second largest share of demand for crude oil globally at 19%. Oil is a feedstock to the petrochemical industry, which uses it to produce a wide range of plastic products (though in North America the more common feedstock is natural gas). Demand destruction in this sector would come from policies aimed at reducing plastic pollution.
The IEA scenarios do not predict such policies will have a major impact on oil demand out to 2050. The IEA calculates petrochemicals’ share of growth to be 50% by 2050 on current trajectories. BP’s assumption is even higher, at 95%. This is based on assumptions about economic growth in developing countries and their catching up with OECD rates of plastic consumption, though others argue that developing country uptake will not mirror historical patterns in developed countries.
Measures such as bans on single-use plastics, now in force in a slew of countries, only nibble at the edges of demand, but a global ban would reduce petrochemical-related oil demand by more than a quarter. Aggressive recycling policy and legislation could lead to more significant impacts, reducing annual growth in oil demand by up to 1% by 2040 or the possibility of peak plastic demand by 2027.
There is growing momentum behind regulatory policies to reduce plastic use more broadly and accelerate recycling. For example, a new multilateral environmental agreement on plastics is progressing quickly. The resulting multilateral agreement is expected to facilitate national commitments and actions in the same way that the United Nations Framework Convention on Climate Change and its Paris Agreement do for climate change. Critically, the scope of talks includes considering measures along the entire life cycle of plastics, including production restrictions.
The IEA’s Net-Zero scenario requires an increase in plastics recycling rates globally, from 17% to 27%, by 2030, and even that would fail to completely avoid an increase in oil demand for the sector—predicted at 1.5 mbpd. But while reduction in plastics demand in the near term may only marginally affect oil demand, the strong rise in multilateral and national regulatory efforts to reduce plastics pollution is likely to have significant impacts post-2030.
Aviation and Shipping
Policies and technologies are not as advanced in the area of aviation and shipping, which accounts for 12% of final demand for crude oil globally. However, policy responses are beginning to take shape. In aviation, 2021 brought a flurry of net-zero pledges from major global carriers and associations. In the same year, 28 states signed on to the International Aviation Climate Ambition Coalition (COP 26 declaration, 2022), committing to a pathway consistent with the Paris Agreement 1.5°C target, and the U.S. Federal Aviation Authority (2021) committed to net-zero by 2050. Proposed mandates such as ReFuel EU and the United Kingdom’s Jet Zero Consultation will act as drivers of cost reduction and uptake for sustainable aviation fuel, which will eventually anchor emission reductions in long-haul flights. For short-haul flights, alternatives have advanced enough that Sweden and Denmark have announced that all domestic flights will be fossil fuel-free by 2030, with Norway aiming for 2040.
While the shipping sector is not likely to contribute to a significant displacement of oil demand between now and 2030, a revision to the International Convention for the Prevention of Pollution from Ships comes into effect in November 2022, requiring all ships to meet annual ship-specific targets to reduce their carbon intensities—a measure that could cut emissions 11% over 2019 levels by 2026 in a full-compliance scenario (Brooks & Adler, 2021). As well, frustration with the International Maritime Organization’s lack of action is spurring national-level efforts that may have significant impacts, including the European Union's proposal to include shipping in its emissions trading system and legislative proposals in the United States to mandate low carbon intensity for ships docking at U.S. ports (Clean Shipping Act of 2022).

Buildings and Power
Buildings, where oil is used for heating, and power, where oil is used to generate electricity, account for 13% of global oil demand, split fairly evenly between the two. For both end uses, oil has alternatives that are, in most cases, cheaper and cleaner, and even the IEA’s most conservative Stated Policies scenario shows demand for both uses falling by 2030.
Relative to 2020 global demand of 91.3 mbpd, these two sectors show a combined drop in demand of 2.7 mbpd by 2030 in the Announced Policies scenario, or 5.8 mbpd in the Net-Zero scenario.
These are small but significant reductions in global demand that, like the impacts of transport electrification, would manifest in the near term, that is, by 2030.
Global Demand for Oil Will Be in Decline by 2030
Comparing the IEA’s scenarios against observed trends suggests global demand for oil will peak before 2030 and thereafter decline. Similar conclusions have been drawn by other independent analysts, and, in the same vein, the CER’s only plausible scenario shows Canadian production peaking in 2032.
Demand reduction will be driven primarily by road transportation, which accounts for 44% of oil demand. Trends in climate policies, technological improvements, and consumer behaviour suggest demand reduction in line with the IEA’s NZE. These will begin before 2030 and will accelerate thereafter.

For other drivers of demand, it is less certain whether trends will bring us closer to the APS or NZE. In either scenario, buildings and electricity, accounting for 13% of global oil demand, will contribute to demand destruction by 2030, dropping by 3.2 mbpd even in the more conservative APS.
The other major elements of global oil demand—plastics, aviation, and shipping, at 31%—are less likely to achieve the IEA’s NZE conditions by 2030. But in the medium term (post-2030), all of them are likely to contribute significantly to falling demand.
If we assumed the IEA’s NZE trajectory for road transport out to 2030 as argued above, and its more conservative APS trajectory for the other elements of global oil demand whose paths are less certain, the result would be a drop in oil demand from pre-COVID (2019) levels of 22 mbpd, or 22%. These same assumptions carried out to 2050 would reduce demand for oil by 57 mbpd, or 58%, even without assuming any of the trends in aviation, shipping, or plastics lead to more destruction of demand than currently announced policies. To put those numbers in perspective, the drop in global demand that devastated oil markets and sent prices for Western Texas Intermediate briefly negative in 2020 amounted to less than 7 mbpd (though that was more abrupt than the changes envisioned here).
Overall, the data suggests that structural changes in road transport will permanently cause a sustained decline in oil demand in the very near term. Post-2030, this will be compounded by reduced oil demand for other key uses. What this means for Canadian producers specifically is not straightforward and will be assessed in future installments of The Bottom Line policy brief series. But the inescapable starting point for Canadian energy policy is clear: global demand for oil will soon unravel in an unprecedented fashion and will not recover.
Re-Energizing Canada is a multi-year IISD research project envisioning Canada's future beyond oil and gas. This publication is part two of The Bottom Line policy brief series, which digs into the complex questions that will shape Canada's place in future energy markets.
You might also be interested in
In Search of Prosperity: The role of oil in the future of Alberta and Canada
This report assesses the market outlook for Alberta’s oil sector, using new modelling and a comprehensive analysis of eight key factors affecting the sector’s future.
Why Canadian Liquefied Natural Gas Is Not the Answer for the European Union’s Short-Term Energy Needs
This investigation shows that Canadian LNG infrastructure would come too late to address Europe’s energy security needs and offer little benefit to Canada’s economy.
Making Good Green Jobs the Law: How Canada can build on international best practice to advance just transition for all
This report provides recommendations for federal legislation that can advance just transition in Canada.
The Production Gap
The report measures the gap between governments' planned fossil fuel production and the global production levels consistent with the Paris Agreement.