Every spring the IISD Experimental Lakes Area (IISD-ELA) staff put up a calendar and vote on which day they think the ice will melt on Lake 239, one of our long-term reference lakes. The IISD-ELA camp sits on the shore of Lake 239, and we have been tracking its “ice-on” (freeze-up) and “ice-off” (break-up) dates since 1969. Whoever guesses the correct ice-off date wins a homemade wild blueberry pie, so you can imagine that the competition gets a little heated!
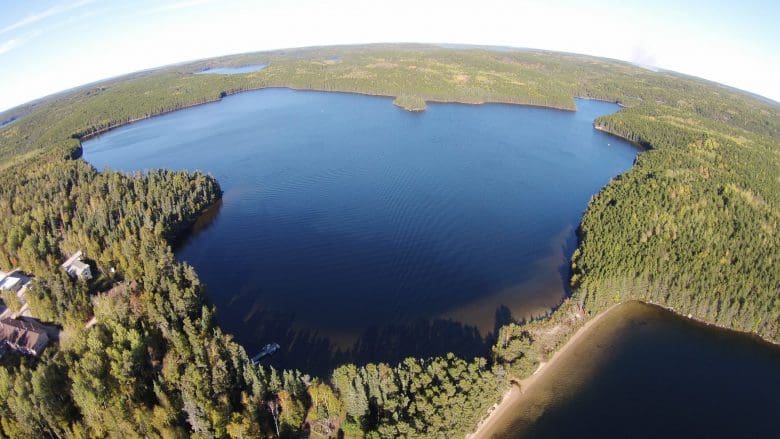
Lake 239 from the air. The IISD-ELA camp is visible in the bottom left corner.
Ice-on and ice-off are defined as the point when ~80% of the lake is ice-covered or ice-free, respectively. Over our 48 year record, the earliest the ice has ever melted on Lake 239 is April 5 (in 2012), and the latest is May 18 (in 2014). For ice-on, the earliest on record is November 4 (in 1991) and the latest was this year on December 10 (in 2016).
The large range in break-up and freeze-up dates means that the annual duration of ice cover can range in length by several weeks. Since we began conducting research in 1969, we have seen the winters getting shorter and have observed a reduction in the duration of ice cover at a rate of about 4.24 days per decade (as explored in our blog post from last spring). A change in ice cover can have implications for many things in lakes, including physical parameters (such as temperature and evaporation), chemical parameters (such as oxygen concentration), and biological parameters (such as fish spawning periods).
In order to be able to predict the ice dates at IISD-ELA more accurately, our researchers have developed a basic model. However, it is a complicated question because ice formation/degradation is affected by many different factors such as lake size and depth, wind, temperature, sunshine, etc. We have had some success, but the temporal resolution of the model has proven a challenge. Since there is a delicious pie on the line, this is obviously a problem.
How have we set about trying to solve it? In true IISD-ELA style, we decided to collaborate.
Since March 2016, IISD-ELA researchers have been working with researchers from the Canada Centre for Remote Sensing (CCRS), a part of Natural Resources Canada (NRCan), in an effort to improve our ability to predict ice-on/-off dates both at IISD-ELA and for other lakes across Canada. By combining (i) what we see in images taken of IISD-ELA lakes, with (ii) ice coverage information derived from RADARSAT-2 satellite images (from CCRS), we will be able to strengthen the models and enhance our understanding of the variables that influence ice cover.
To do this, we selected a suite of nine lakes ranging in size from tiny (Lake 470: 4.2 ha) to ones that are quite sizeable for the area (Teggau Lake: 1330 ha) that would be accessible in summer and in winter. As it would be impractical to try to assess ice-on/-off dates in person, we used time lapse cameras programmed to take photos every hour. RADARSAT-2 images of the IISD-ELA area were acquired every one to three days.
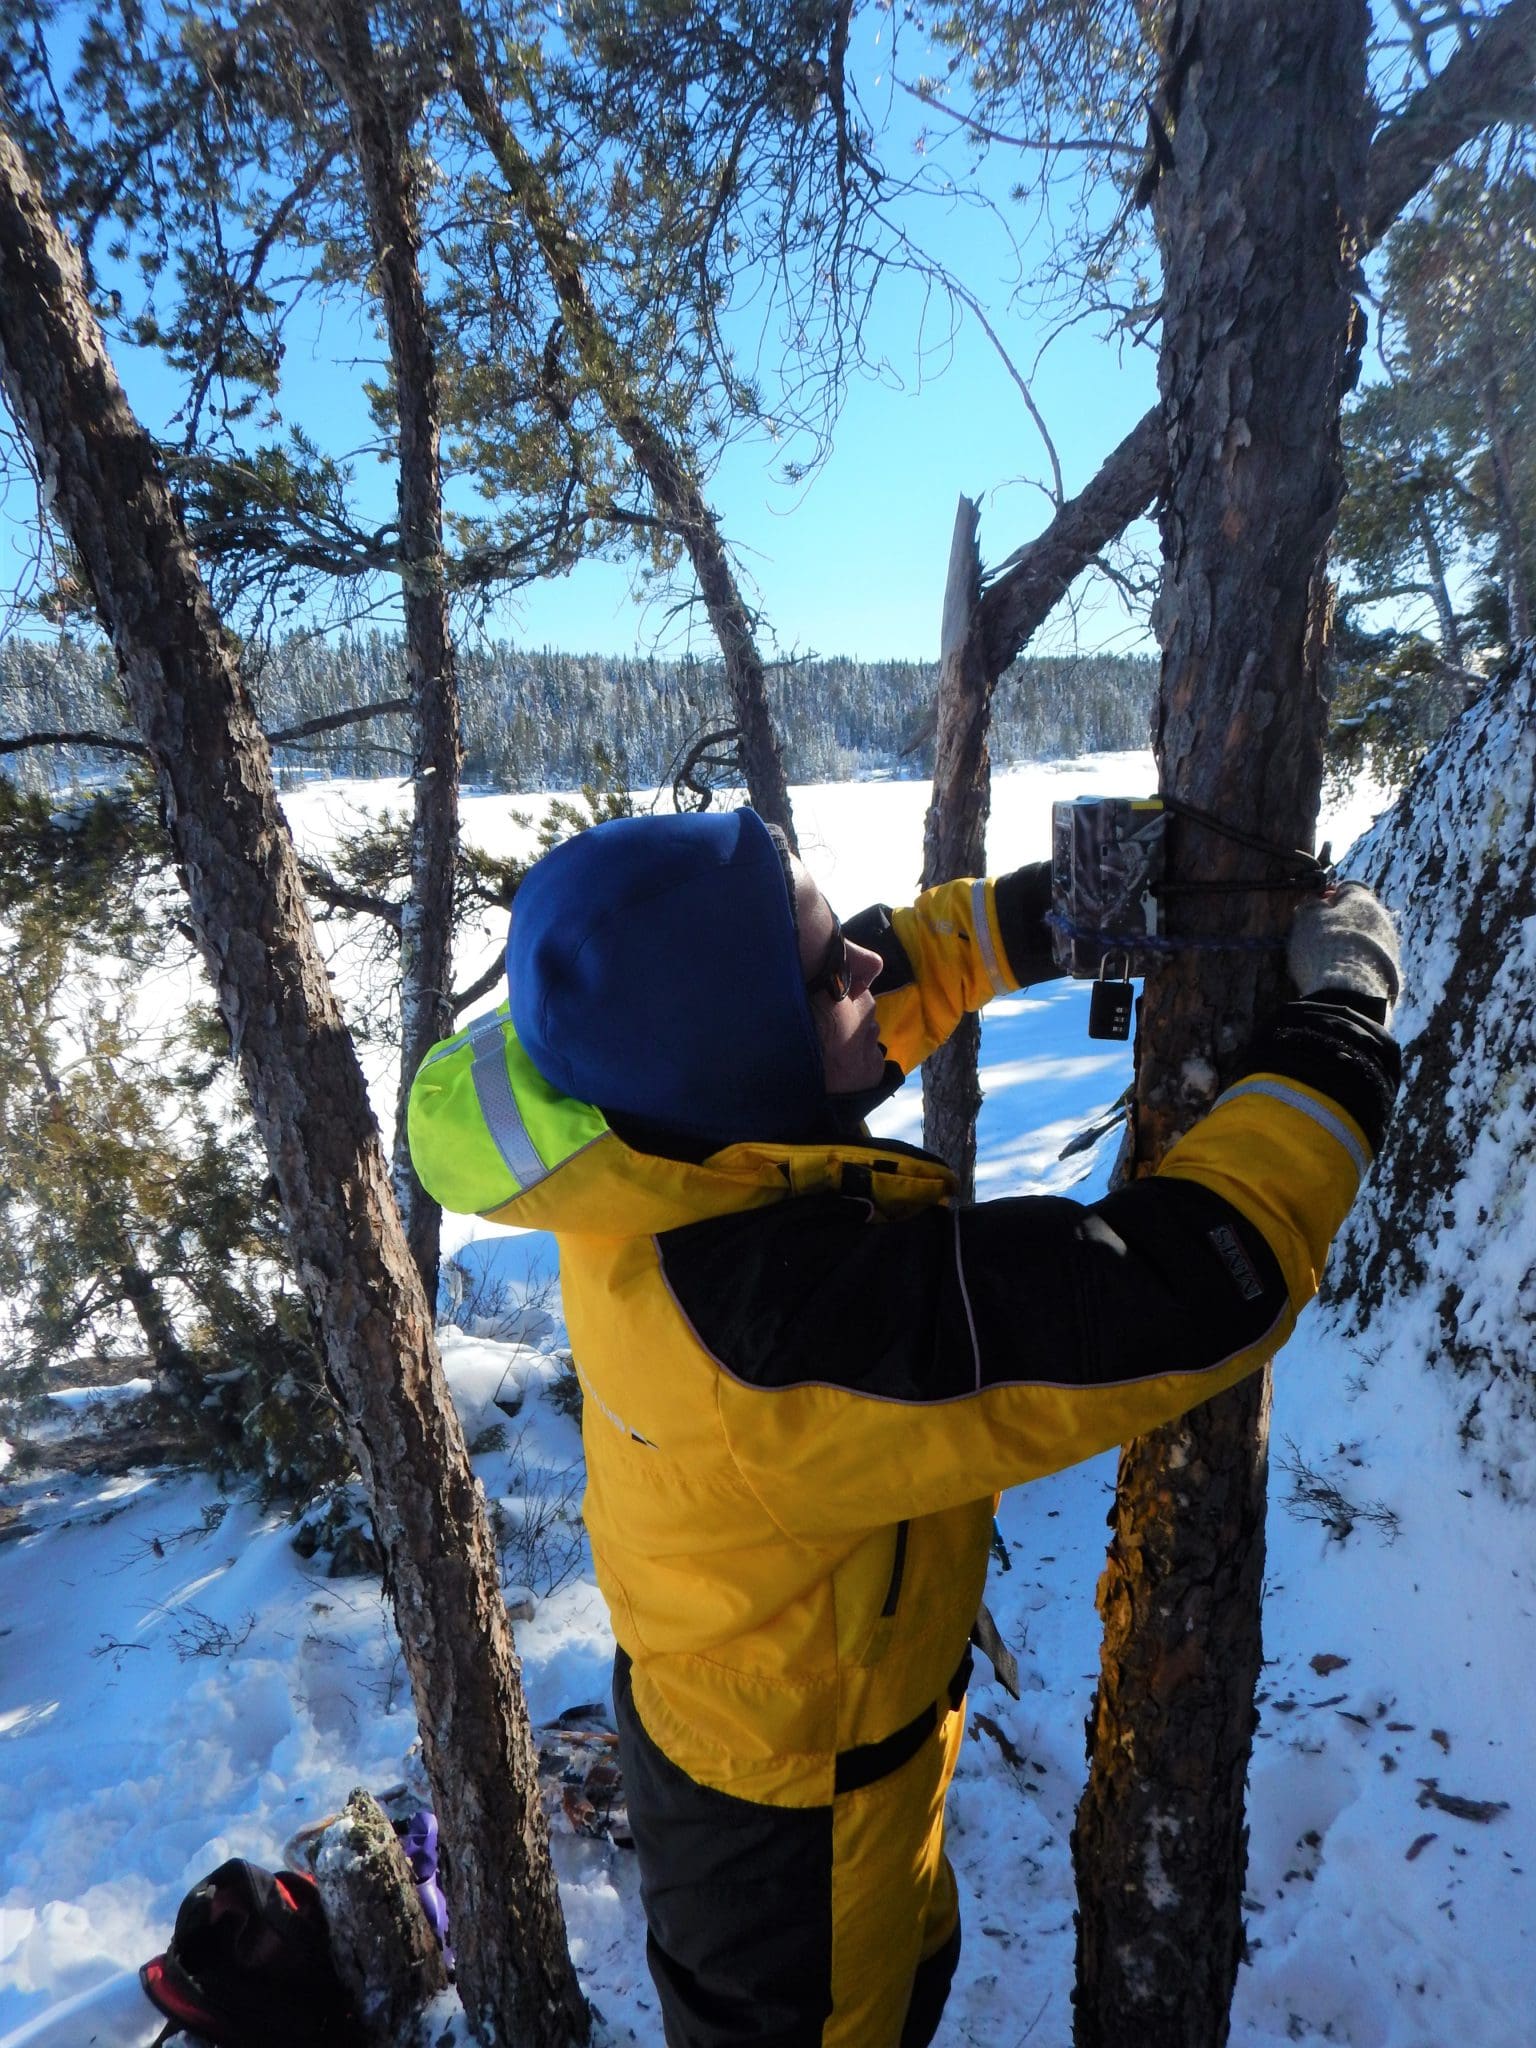
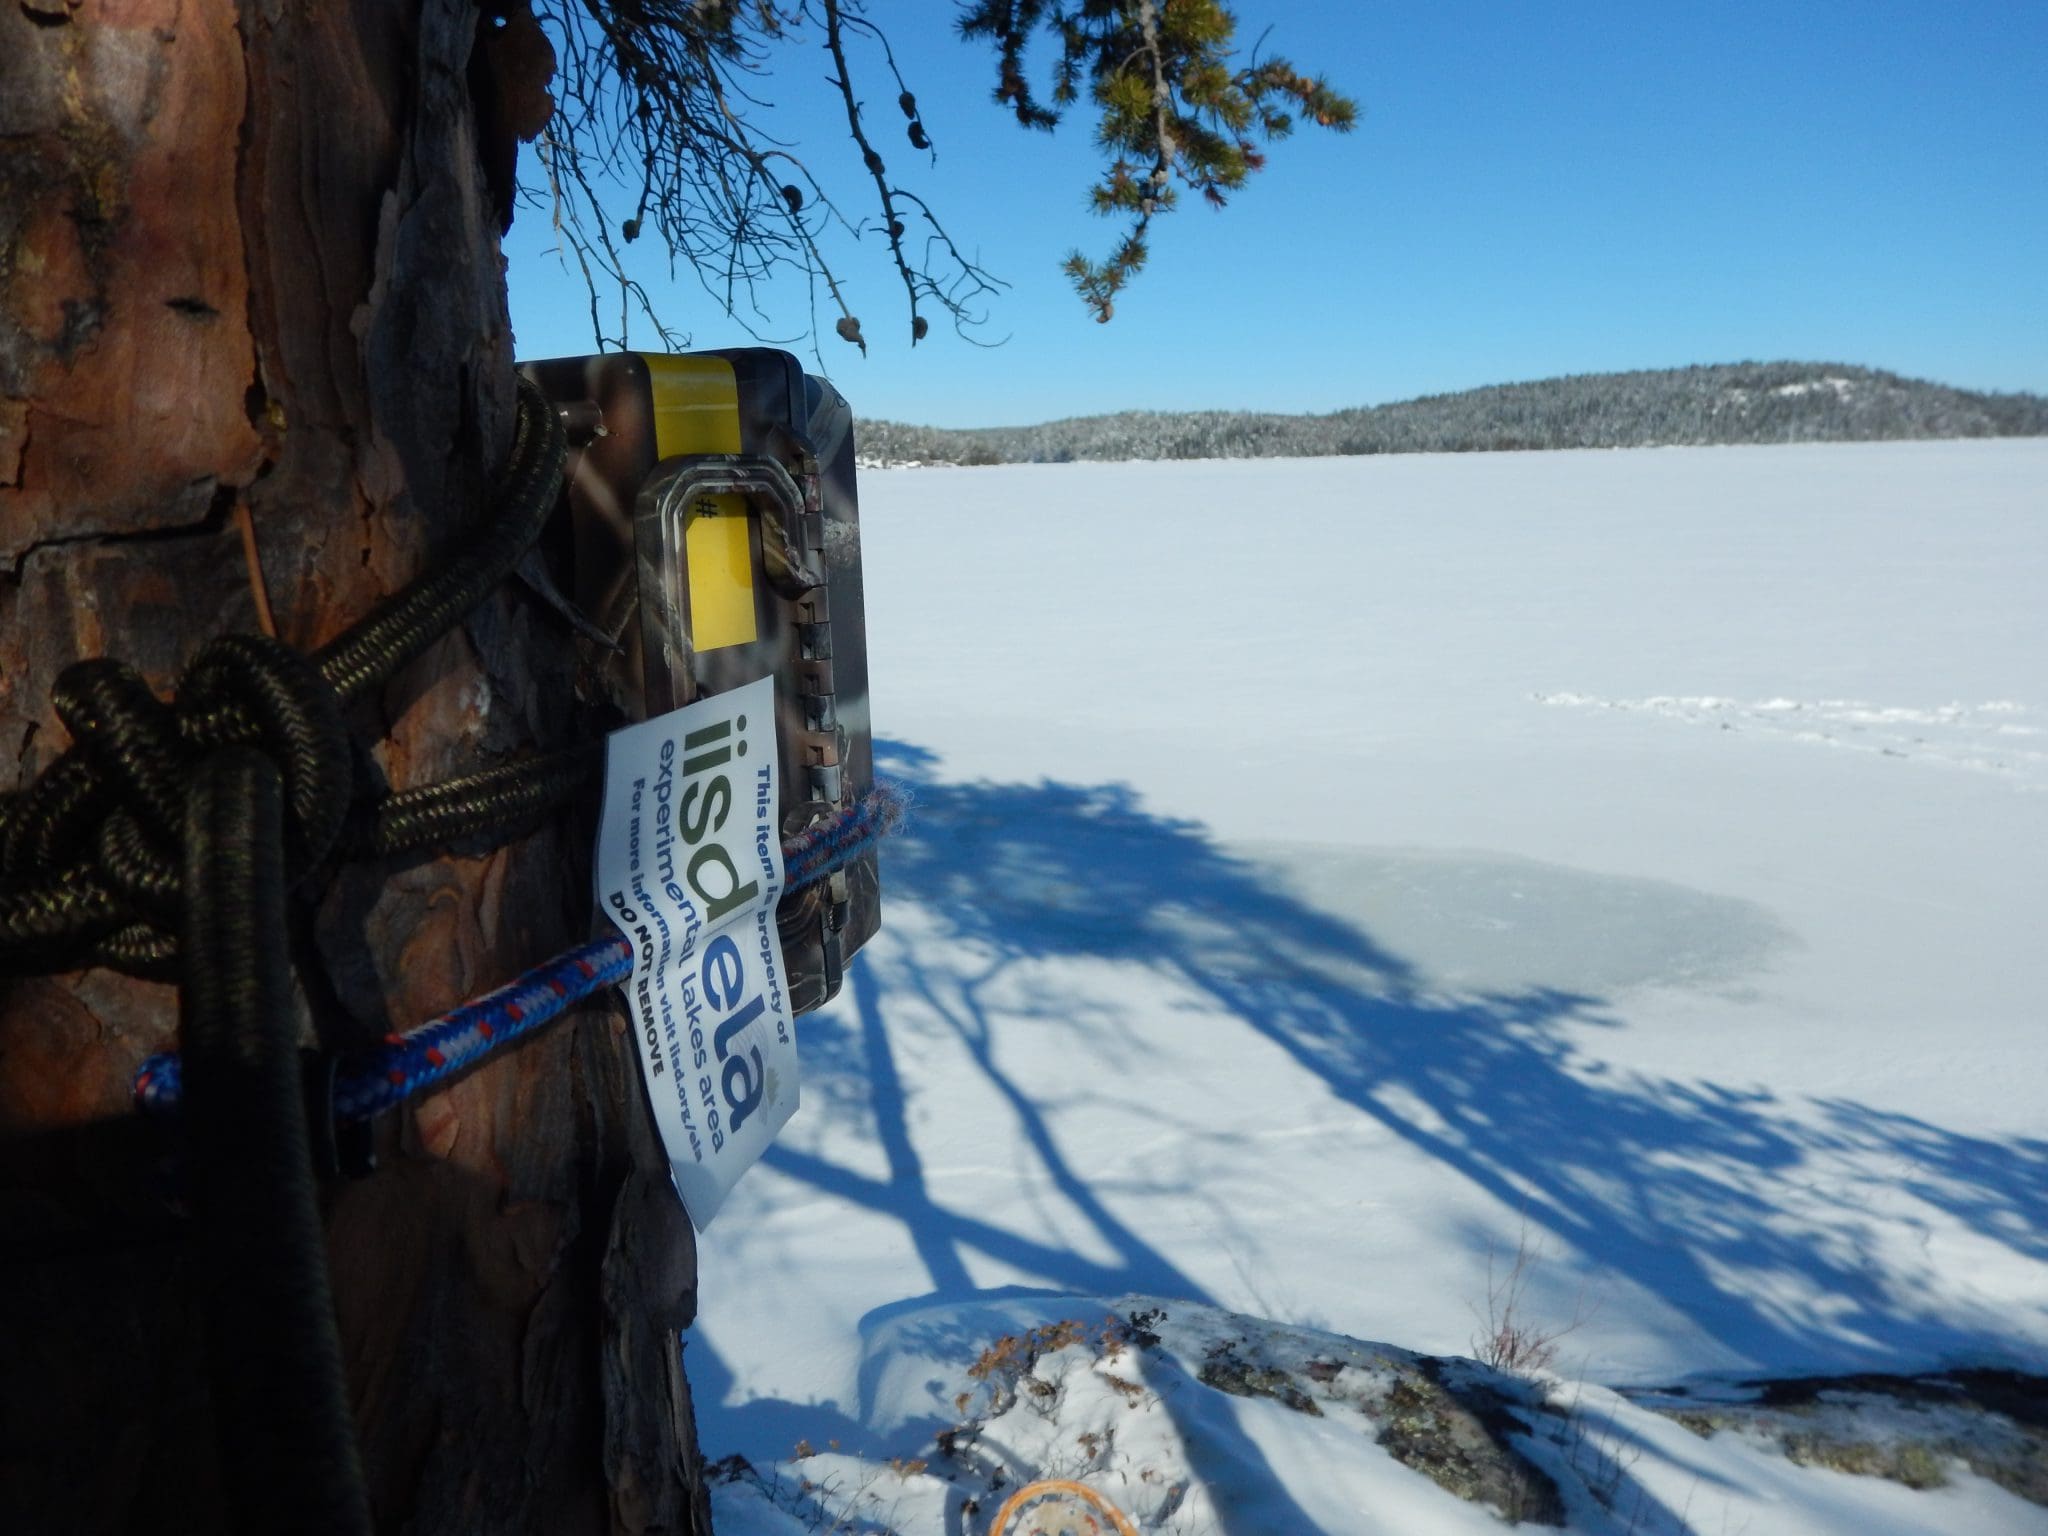
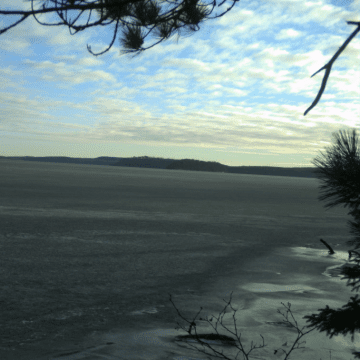
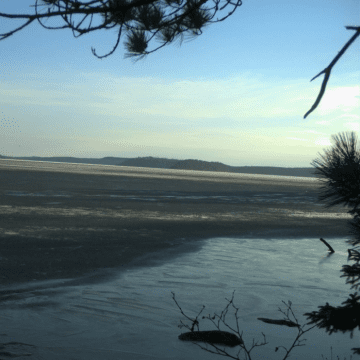
The cameras sit out next to the lakes, attached to trees, for a couple of months over the freeze-up/break-up period, and we retrieve and download them as soon as the ice/water conditions are safe to do so. Each image has a time and date stamp on it so we can tell exactly when the lakes froze/melted.
Break-up on Lake 470 in Spring 2016 (note: time on image is in CST).
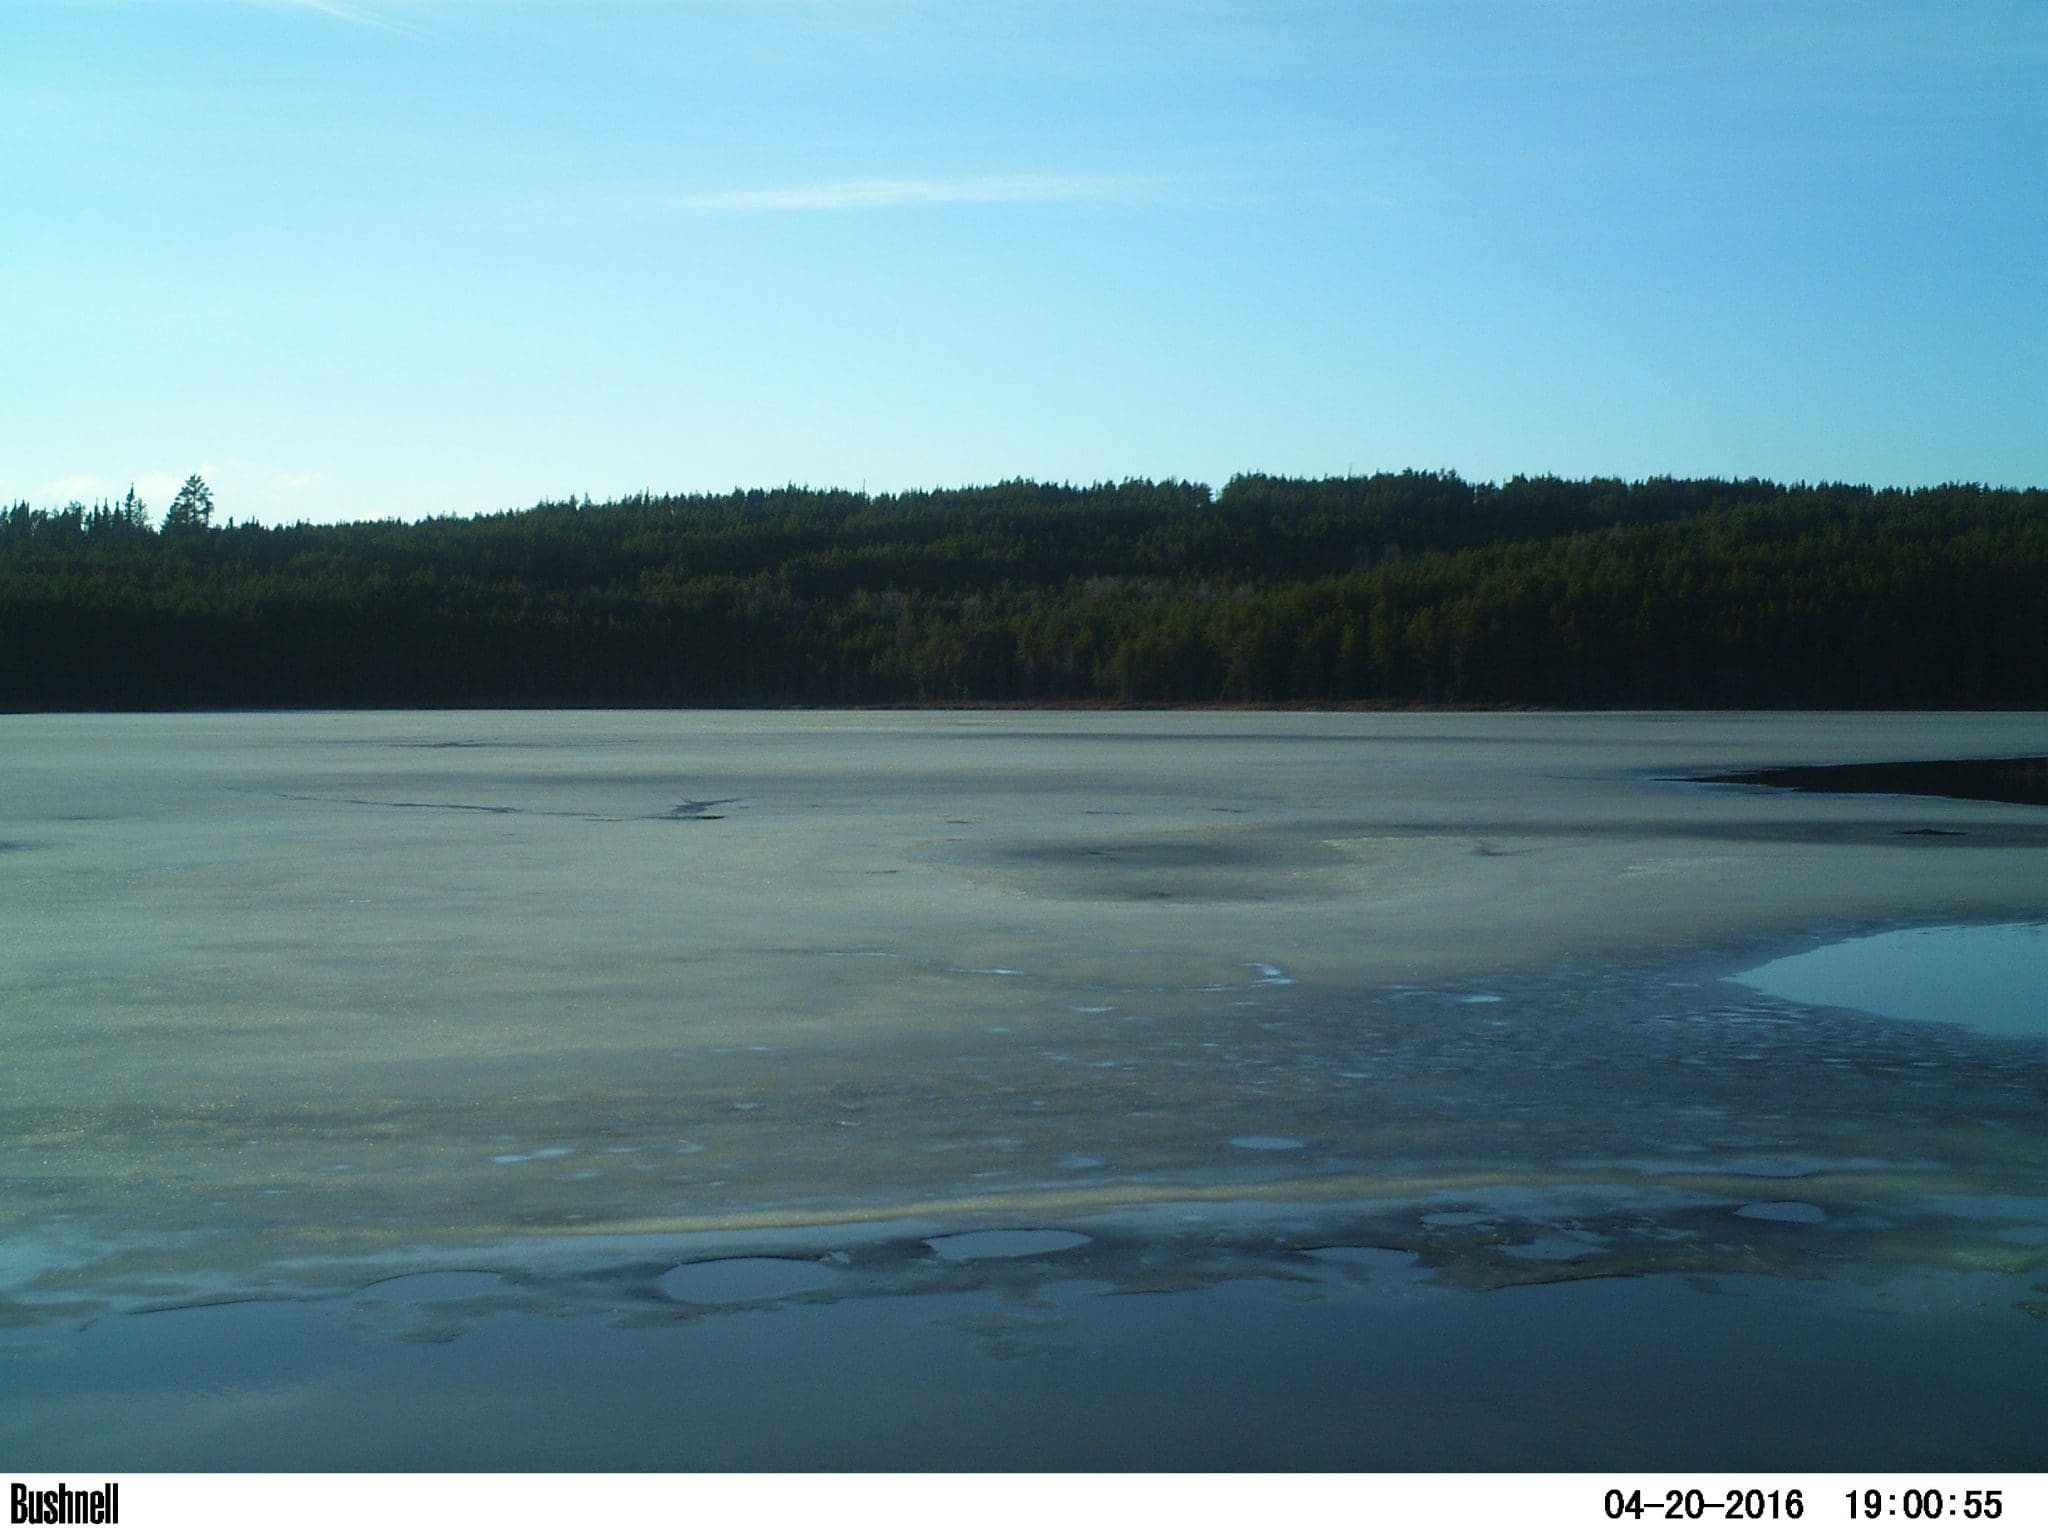
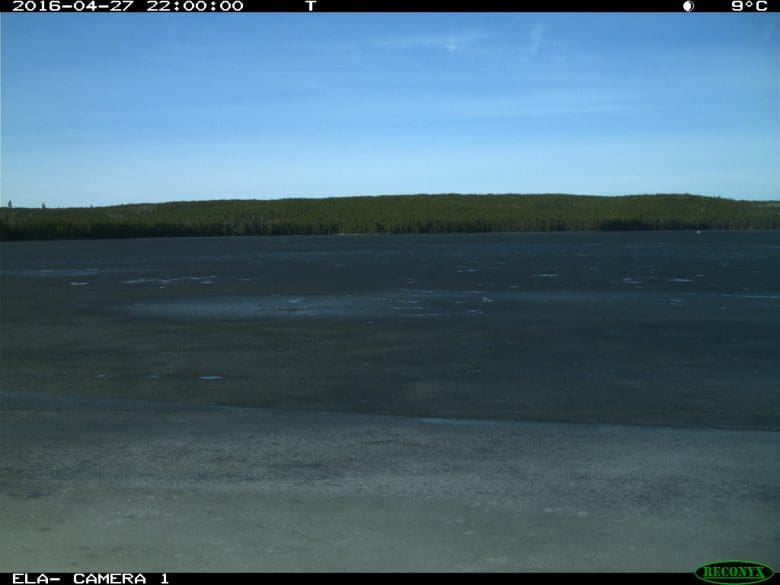
Black ice on Lake 239 just prior to break-up (note: time is in UTC).
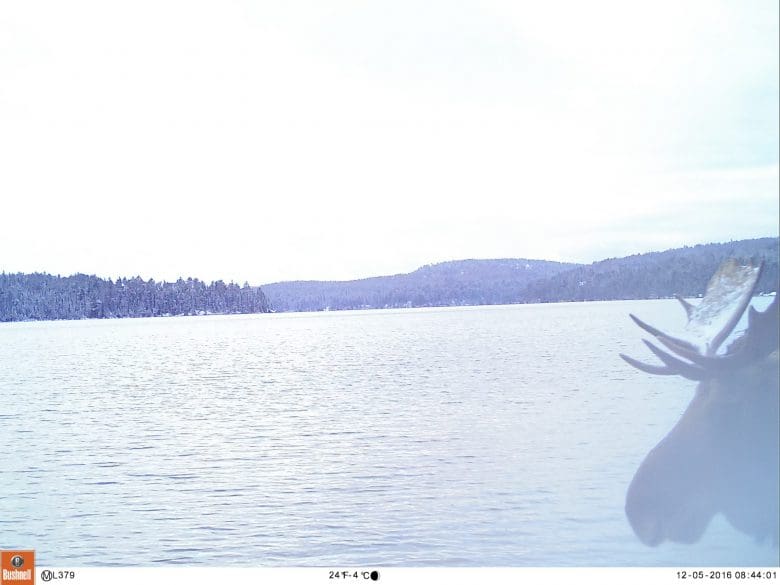
We occasionally catch cool things like moose on the cameras too! This bull took a stroll along the beach on Lake 379 just before freeze-up in December 2016 (note: time is in CST).
In addition to providing precise dates, the images from the cameras provide useful insight into ice and water conditions during break-up and freeze-up. These data are useful because we can compare them to the imagery provided by RADARSAT-2 and use that information to improve the algorithms and automated processes for differentiating between water and ice. What might cause a discrepancy between what the satellite sees and what our cameras see? For example, the satellite radar can have difficulty determining the difference between puddles on ice and open water and, on windy days, between ice and open water. This confusion occurs because the radar “sees” them as similar targets even though they are different things. By comparing the information derived from the radar and time lapse images (or ‘ground-truthing’), CCRS will be able to improve their automated approach to track the freeze-up and break-up of lakes by means of radar satellites.
With financial support from the Canadian Space Agency, CCRS is conducting similar studies using lakes at more northern locations, i.e., near Yellowknife and Inuvik in the Northwest Territories. The combined results from the three study locations should facilitate the development of an analysis approach that yields accurate ice-on and –off products for lakes across Canada using data from the upcoming RADARSAT Constellation Mission. This mission is scheduled for launch in 2018 and will provide daily imaging across Canada’s landmass and coastal waters.
Puddles on the ice and open water at Lake 653 (Geejay Lake) shortly before break-up in April 2016 (note: time is in UTC).
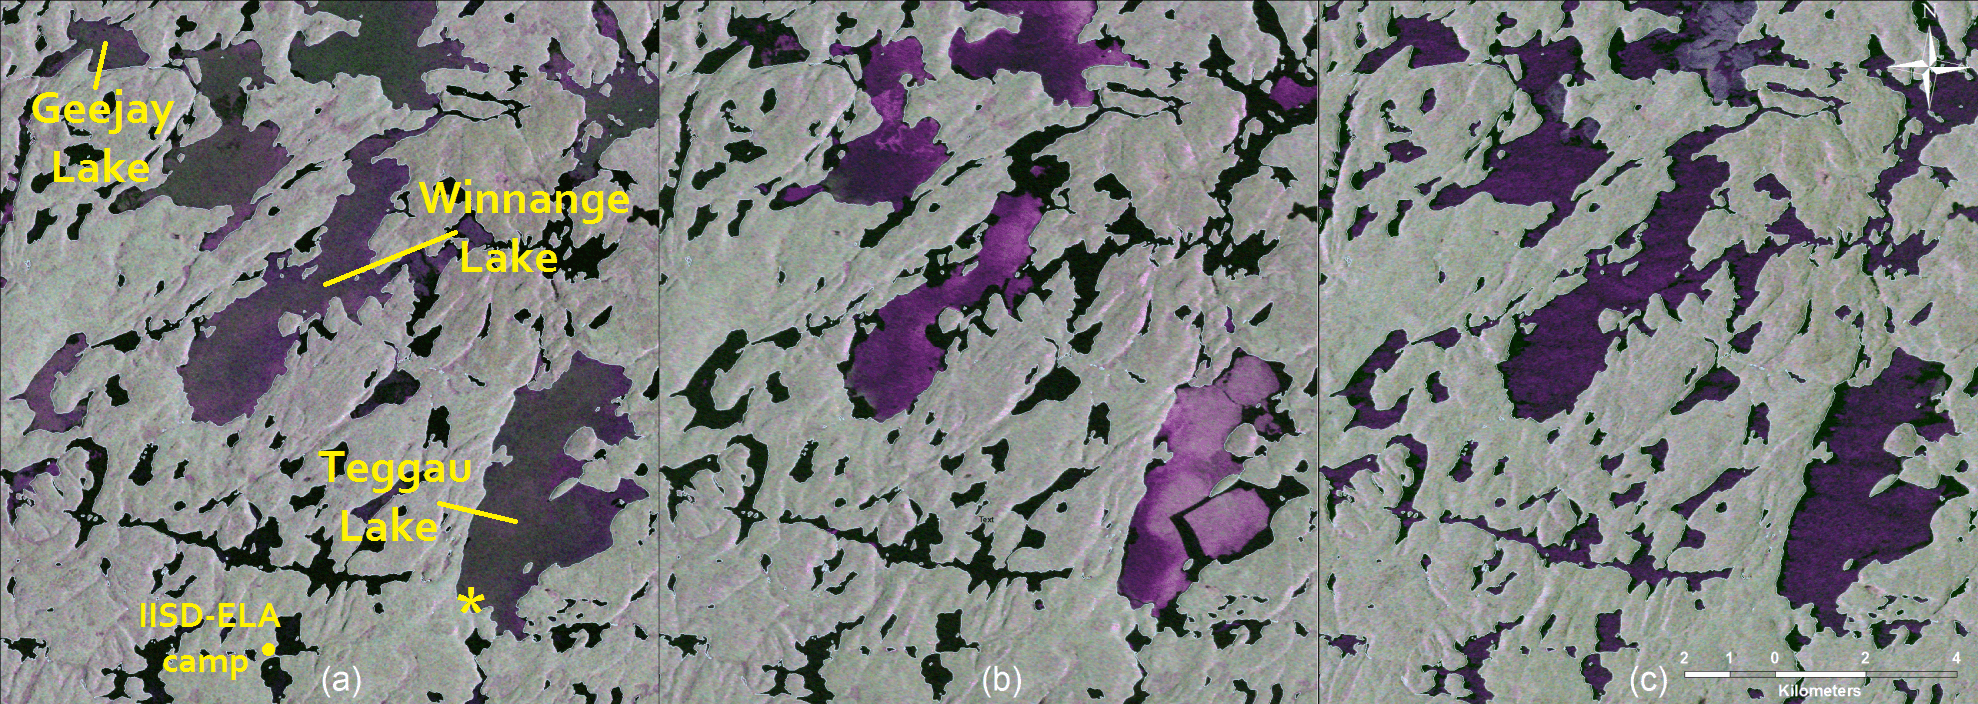
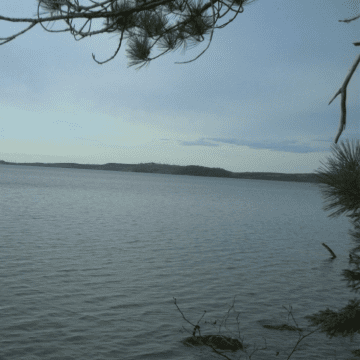
The RADARSAT-2 images below show the IISD-ELA area over a 4-day period in 2016, while the accompanying photos were collected at Teggau Lake at the same times. In panel (a), the smaller lakes are mostly open, while the larger lakes like Teggau, Geejay, and Winnange are mostly frozen. In panel (b), the large lakes have begun to melt, and you can easily see a large pan of ice that has broken away from the rest of the ice in Teggau. In panel (c), Teggau and Geejay Lakes are ice-free, and Winnange Lake just has ice left in the north basin.
RADARSAT-2 multi-polarization images composite (above) showing lakes at IISD-ELA from April 29 to May 02, 2016 (a) April 29, 2016 at 12:24 UTC: Teggau, Winnange, and Geejay lakes are still mostly frozen, smaller lakes in area are open; (b) May 02, 2016 at 12:36 UTC: Teggau and Winnange Lakes have started to open up, Geejay is mostly free of ice; (c) May 02, 2016 at 23:59 UTC: Teggau and Geejay Lakes are ice-free, Winnange still has some ice in the north basin. Images below collected at Teggau Lake (* on panel (a) indicates camera location) at the same times. N.B.: RADARSAT-2 Data and Products © MacDonald, Dettwiler and Associates Ltd. 2016 – All Rights Reserved; RADARSAT is an official mark of the Canadian Space Agency.
Additional information about NRCan’s research on ice can be found here.
Where do we go from here? We now plan to expand this research to include measurements of ice thickness (Winter 2017/18) and thermal properties (Summer 2017) on our study lakes to improve our understanding of the factors that control the duration of ice cover and how it varies across lakes of different size and shape. Ultimately, we hope to couple this information with climate change projections to understand how the duration of ice cover may change over the next 50-100 years.
For now, though, my chances of winning that pie are looking pretty good!
(The break-up of ice on a lake in the spring results from many factors working together, including temperature, wind, ice thickness, etc. Once conditions are right it doesn’t take long for the ice to disappear! This time-lapse video shows the break-up of ice on Lake 114 at IISD-ELA in Spring 2016.)