
Visual Representations of Food Systems: What do we see?
There is increasing recognition that our food comes from a complex set of systems, encompassing agricultural techniques and ecosystems, as well as food security and nutrition—all of which are affected by different governance and policy choices. Recently, a number of agencies have used food system visualizations (FSVs) to illustrate the complexity of these systems. IISD has reviewed a number of FSVs to compare how they focus on and represent different components of food systems and to assess how they cover policy and decision-making priorities, including the Sustainable Development Goals (SDGs).
Our Approach
These findings come from a review of 32 different FSVs published between 1998 and 2020, although most of them were published after 2015. All these FSVs can be viewed on the reference list.
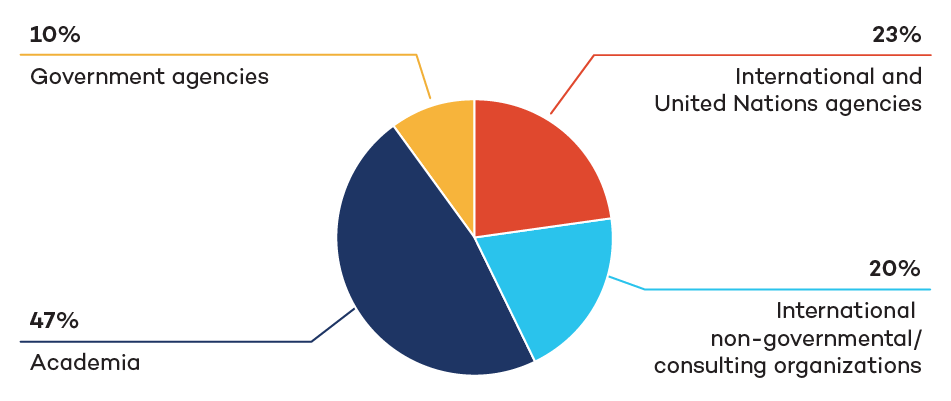
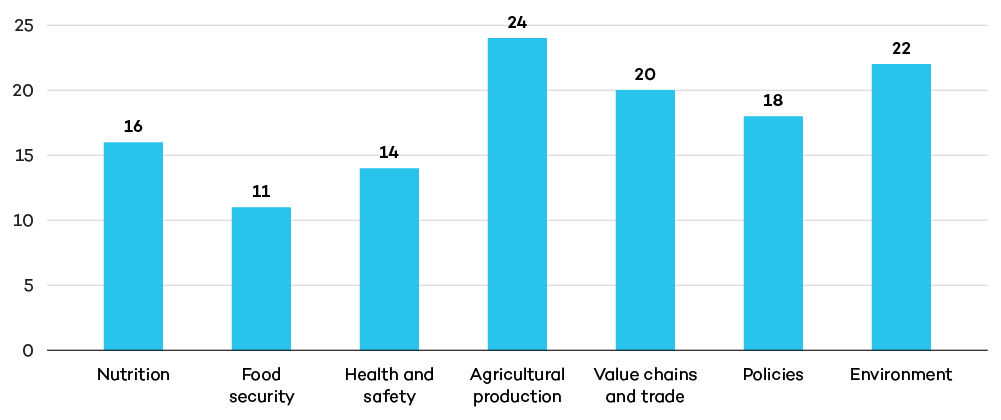
Our review included analyses of the visual representations of food systems as well as the documents in which these visuals were embedded. Most frequently, the FSVs we reviewed were published by academic institutions, followed by international agencies, including the United Nations (Figure 1). We assessed the objectives of the FSVs, type of framework, components of the food systems included in the visual representation, and their relevance for SDG 2 (zero hunger).
Figure 1. Type of agencies developing the FSVs

Purpose
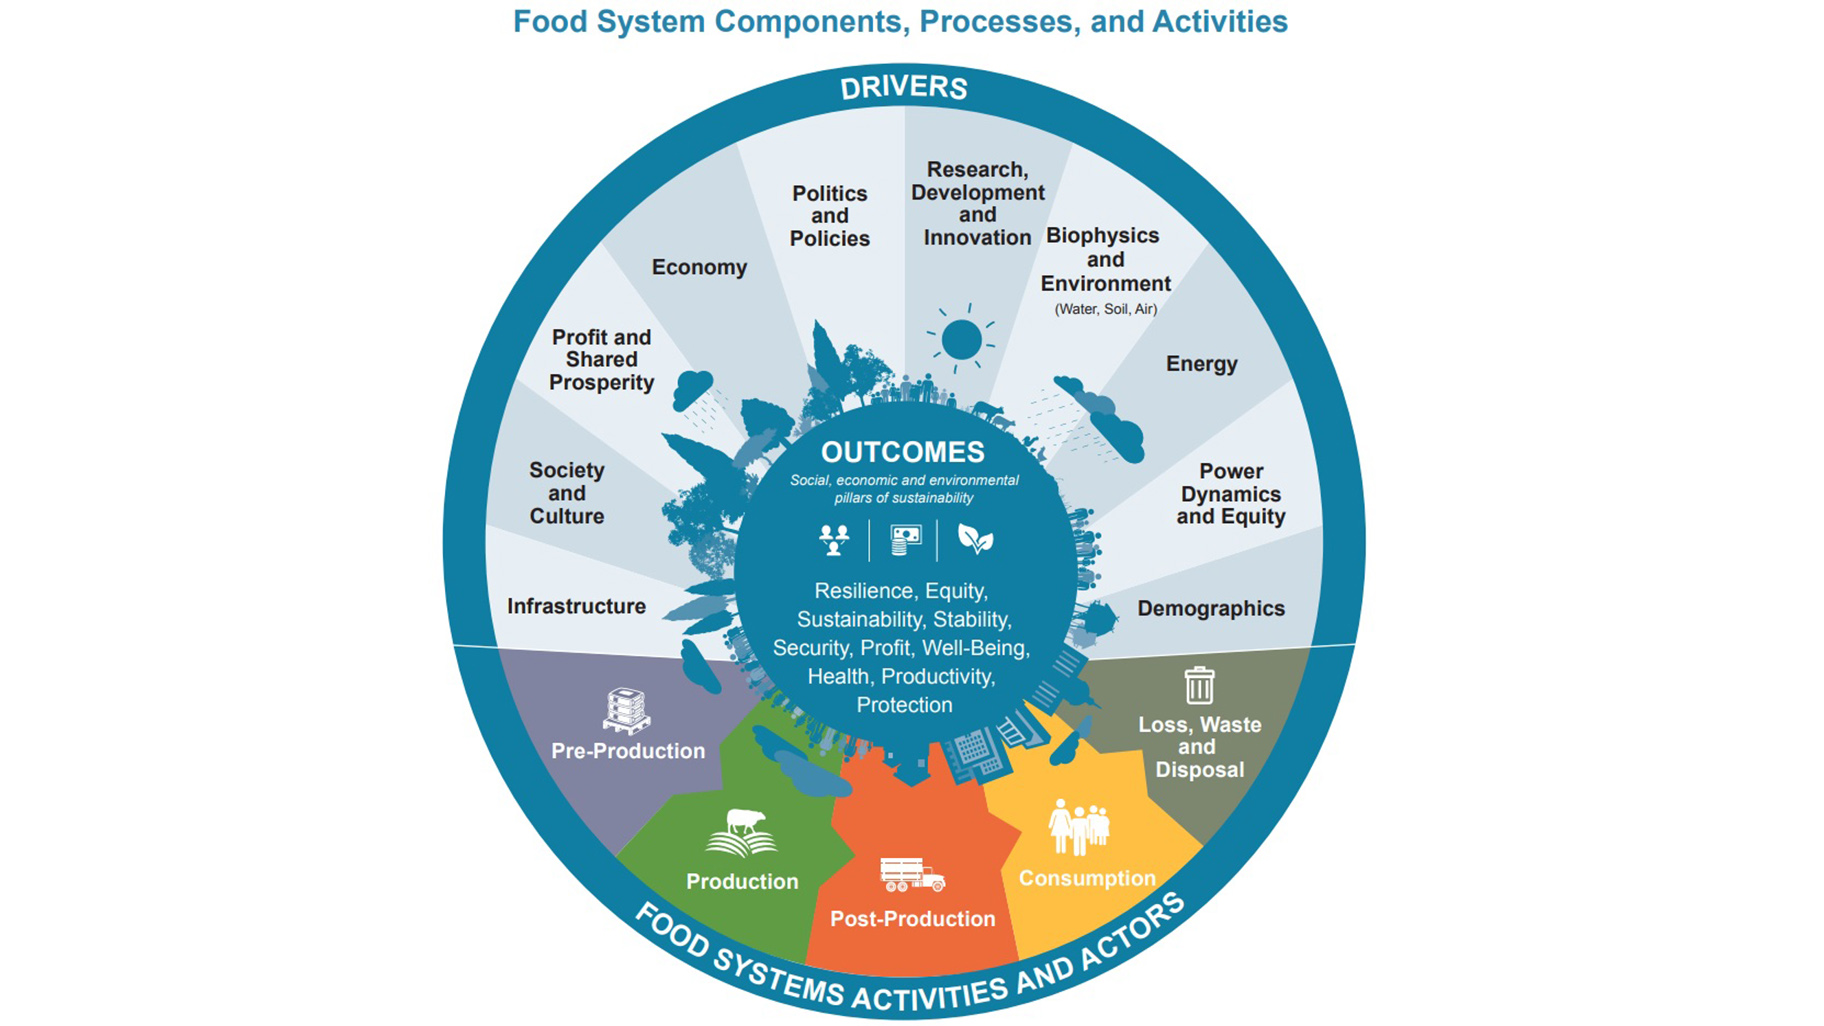
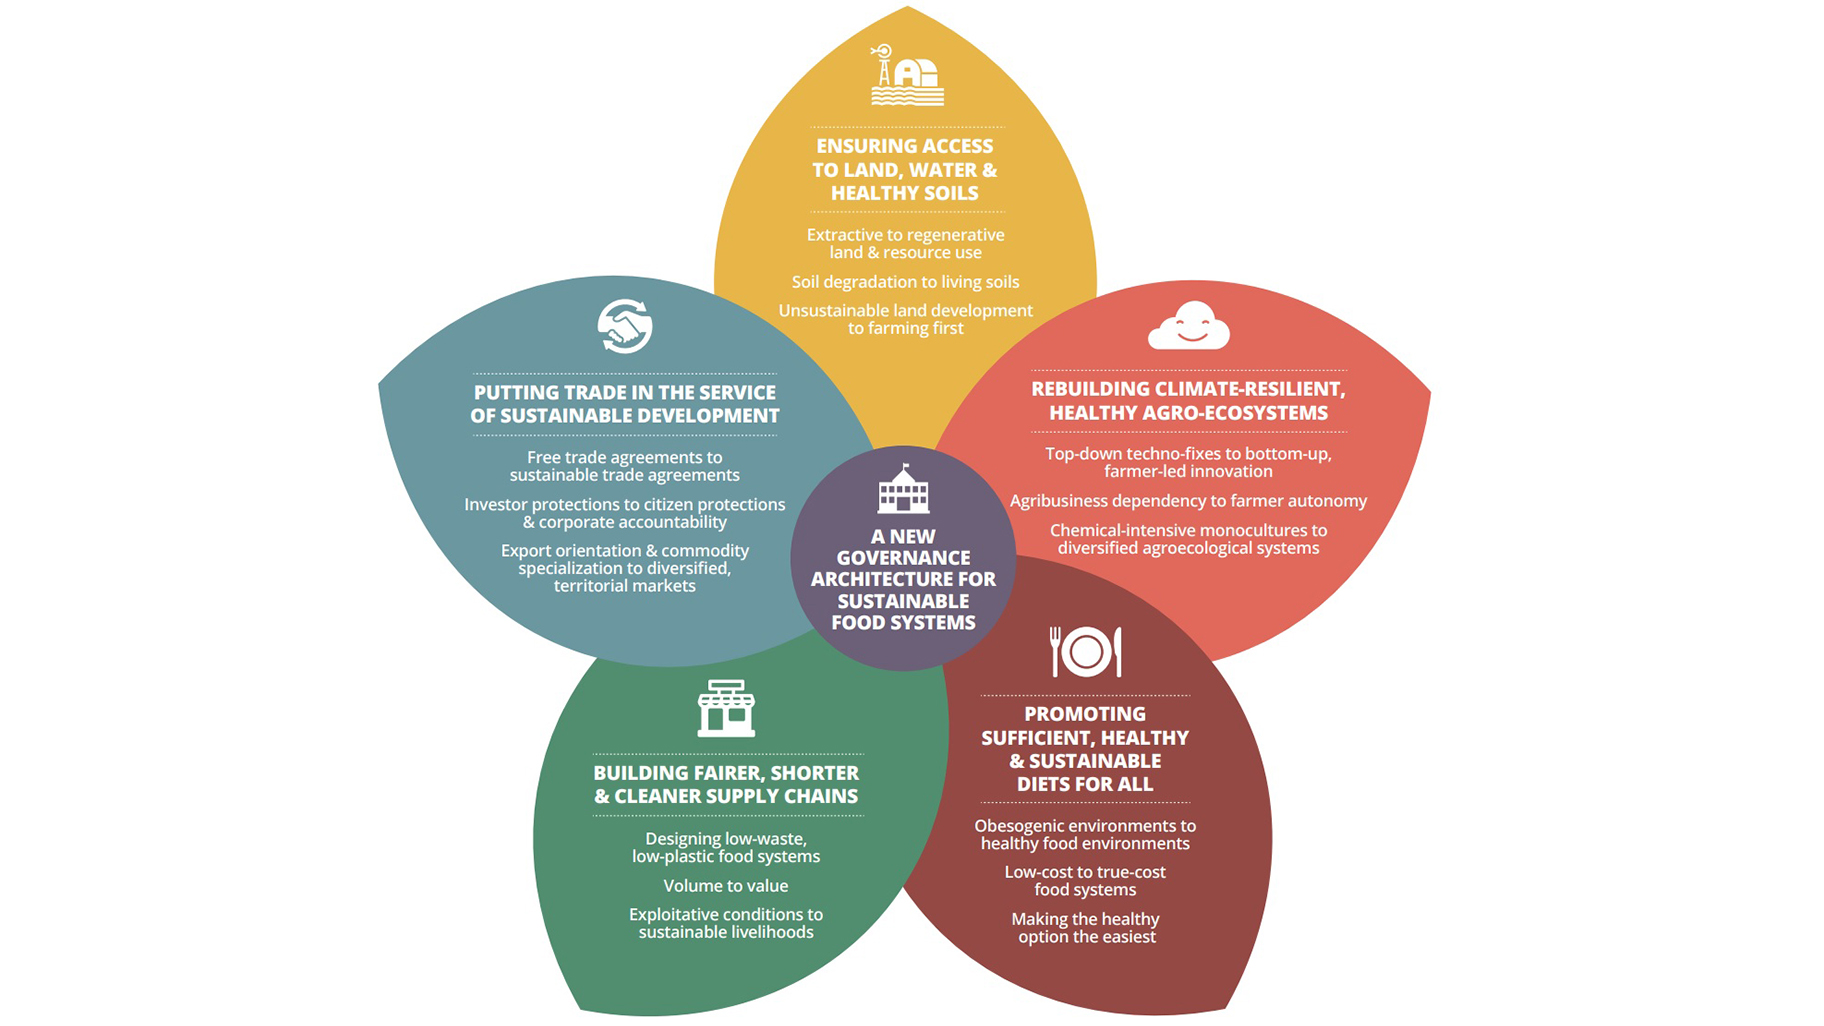
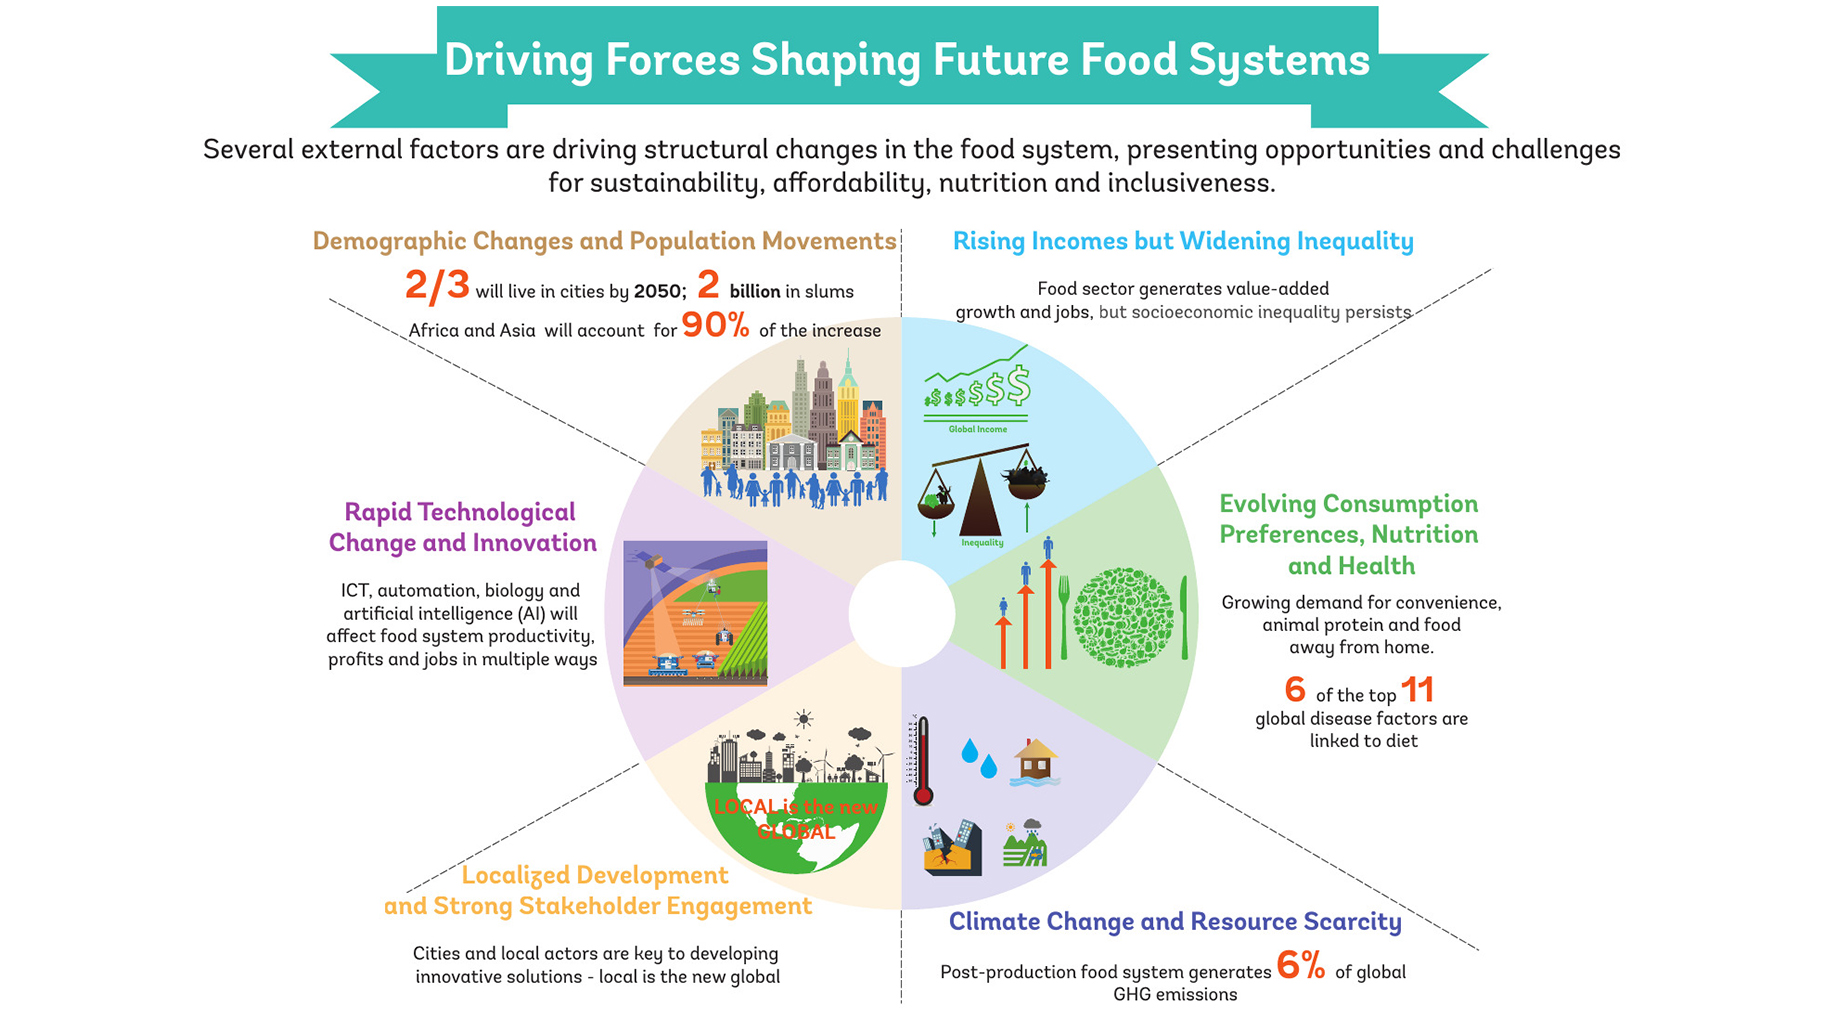
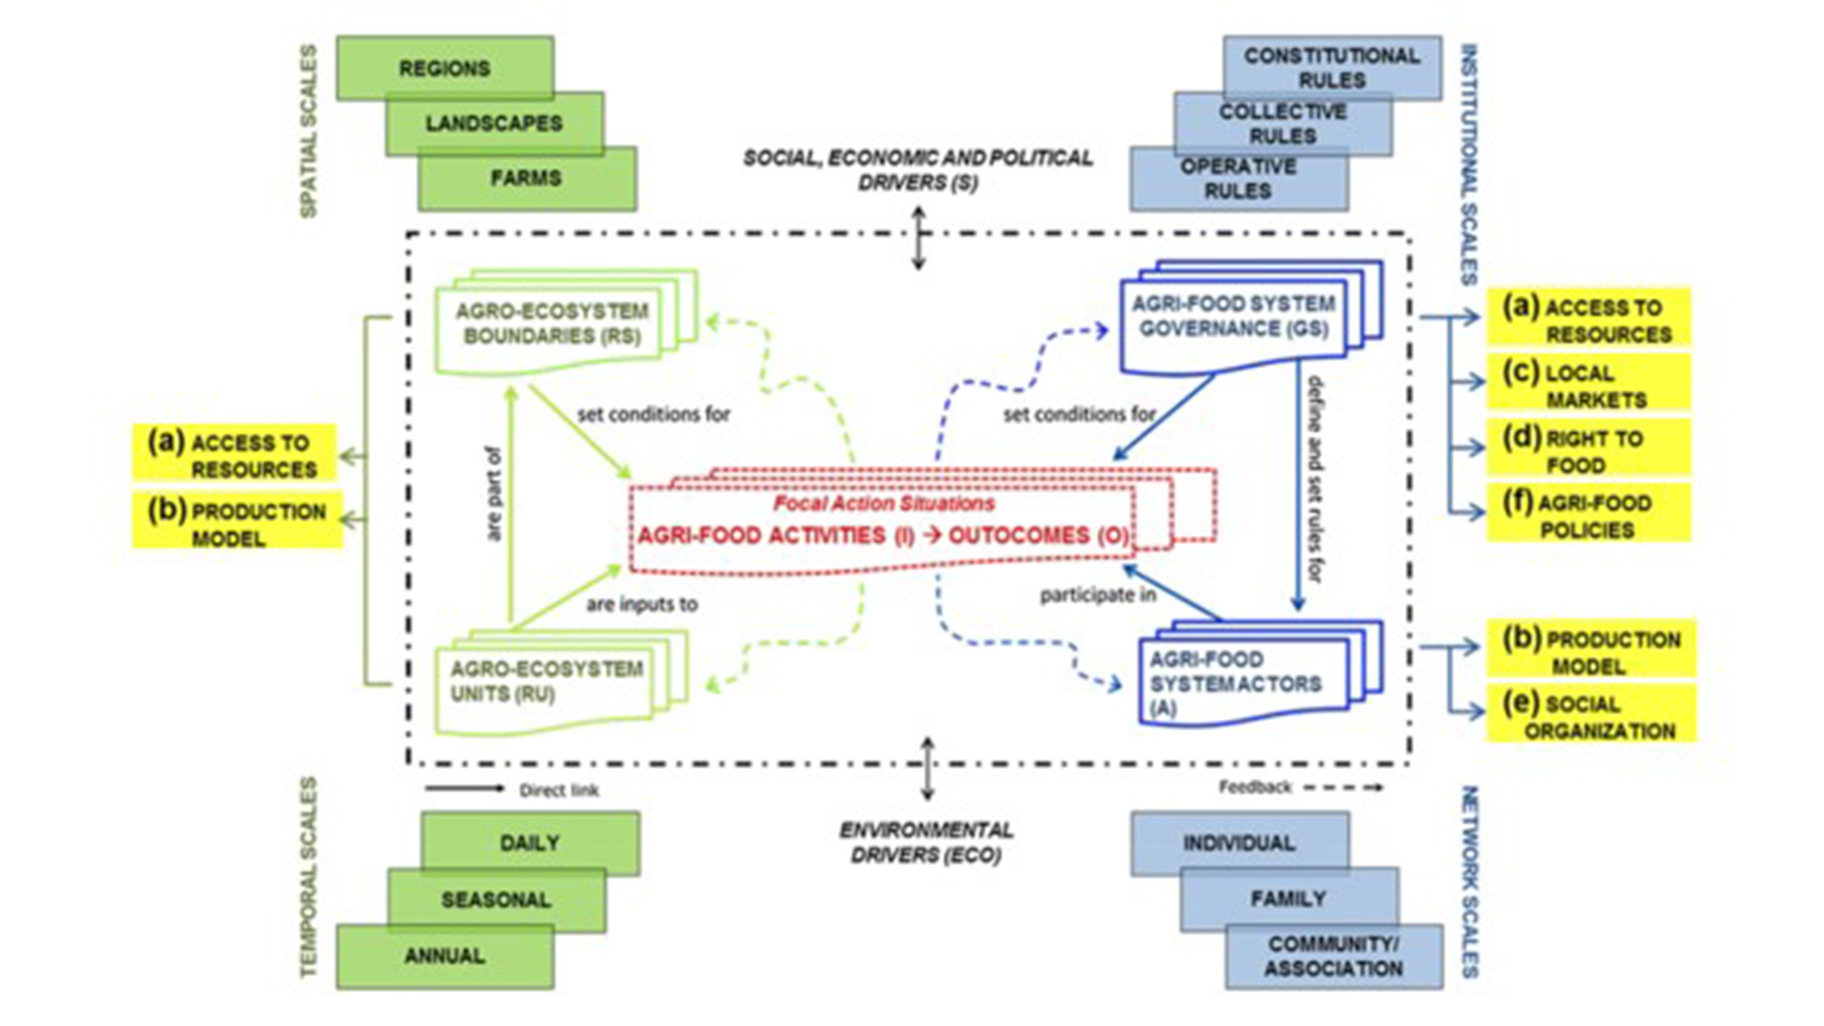
The major aim of the FSVs we reviewed is explanatory. They are intended to support our understanding of the complexity of food systems. This is achieved by bringing together food production with external influences and drivers that affect production, such as climate, population characteristics, and trade, along with system outcomes such as access to food, diets, and nutrition. This kind of visual representation can help to illustrate not only the diverse components of food systems but also their linkages and interactions. Some of the FSVs specifically focused on particular aspects, such as climate change, deforestation, and greenhouse gas emissions, or community-based food systems and local economic development—in the latter case, to support local government planning and investment.
Examples of reviewed FSVs illustrating the complex nature of food systems


Policy Focus
Policy relevance is not often a primary objective of these FSVs, but a number of them do cover relevant policy issues. Some represent food system governance issues, such as trade agreements and political systems, or institutional and organizational issues, such as food safety and market structure. Some of them list specific types of policies influencing food system outcomes, such as food safety policy, economic policy, agricultural policy, trade policy, environmental policy, and urban and rural development policies.
Examples of reviewed FSVs illustrating the inclusion on policy issues

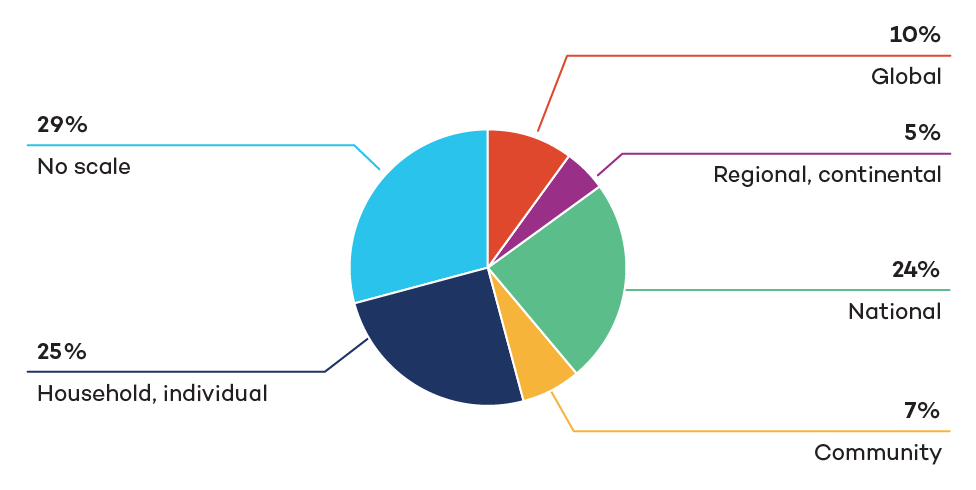
Scale
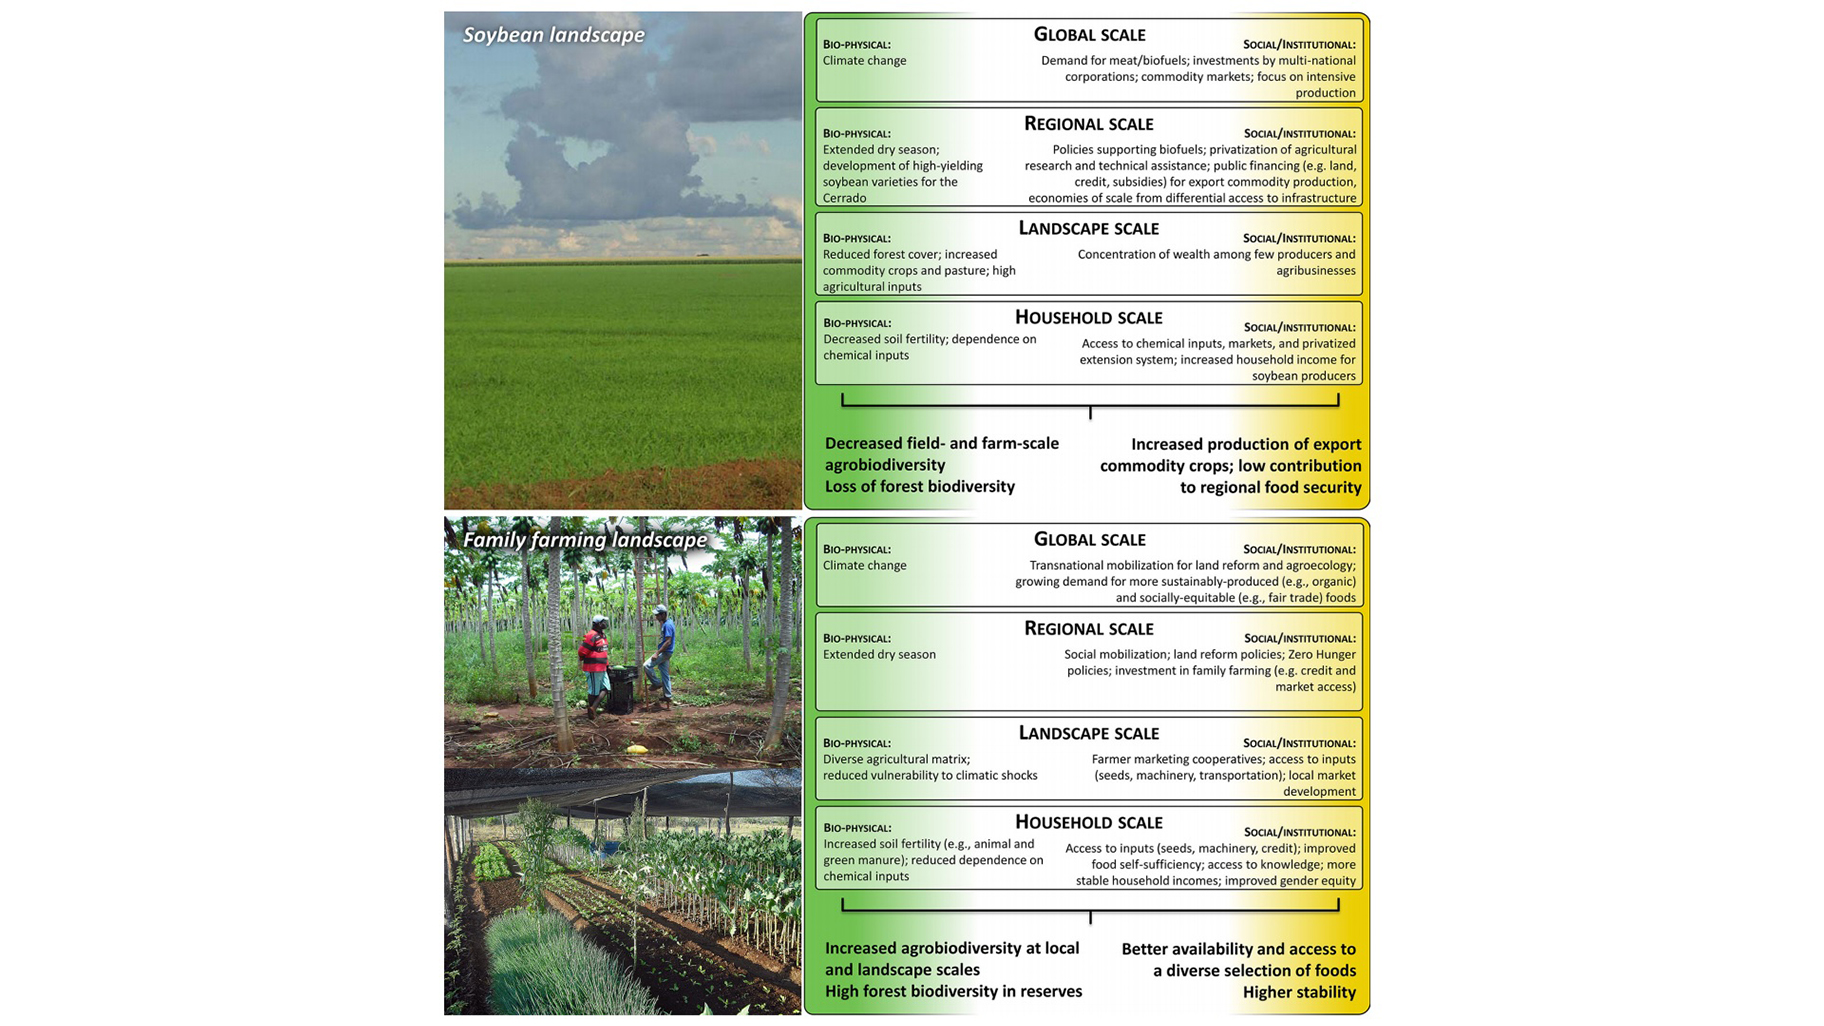
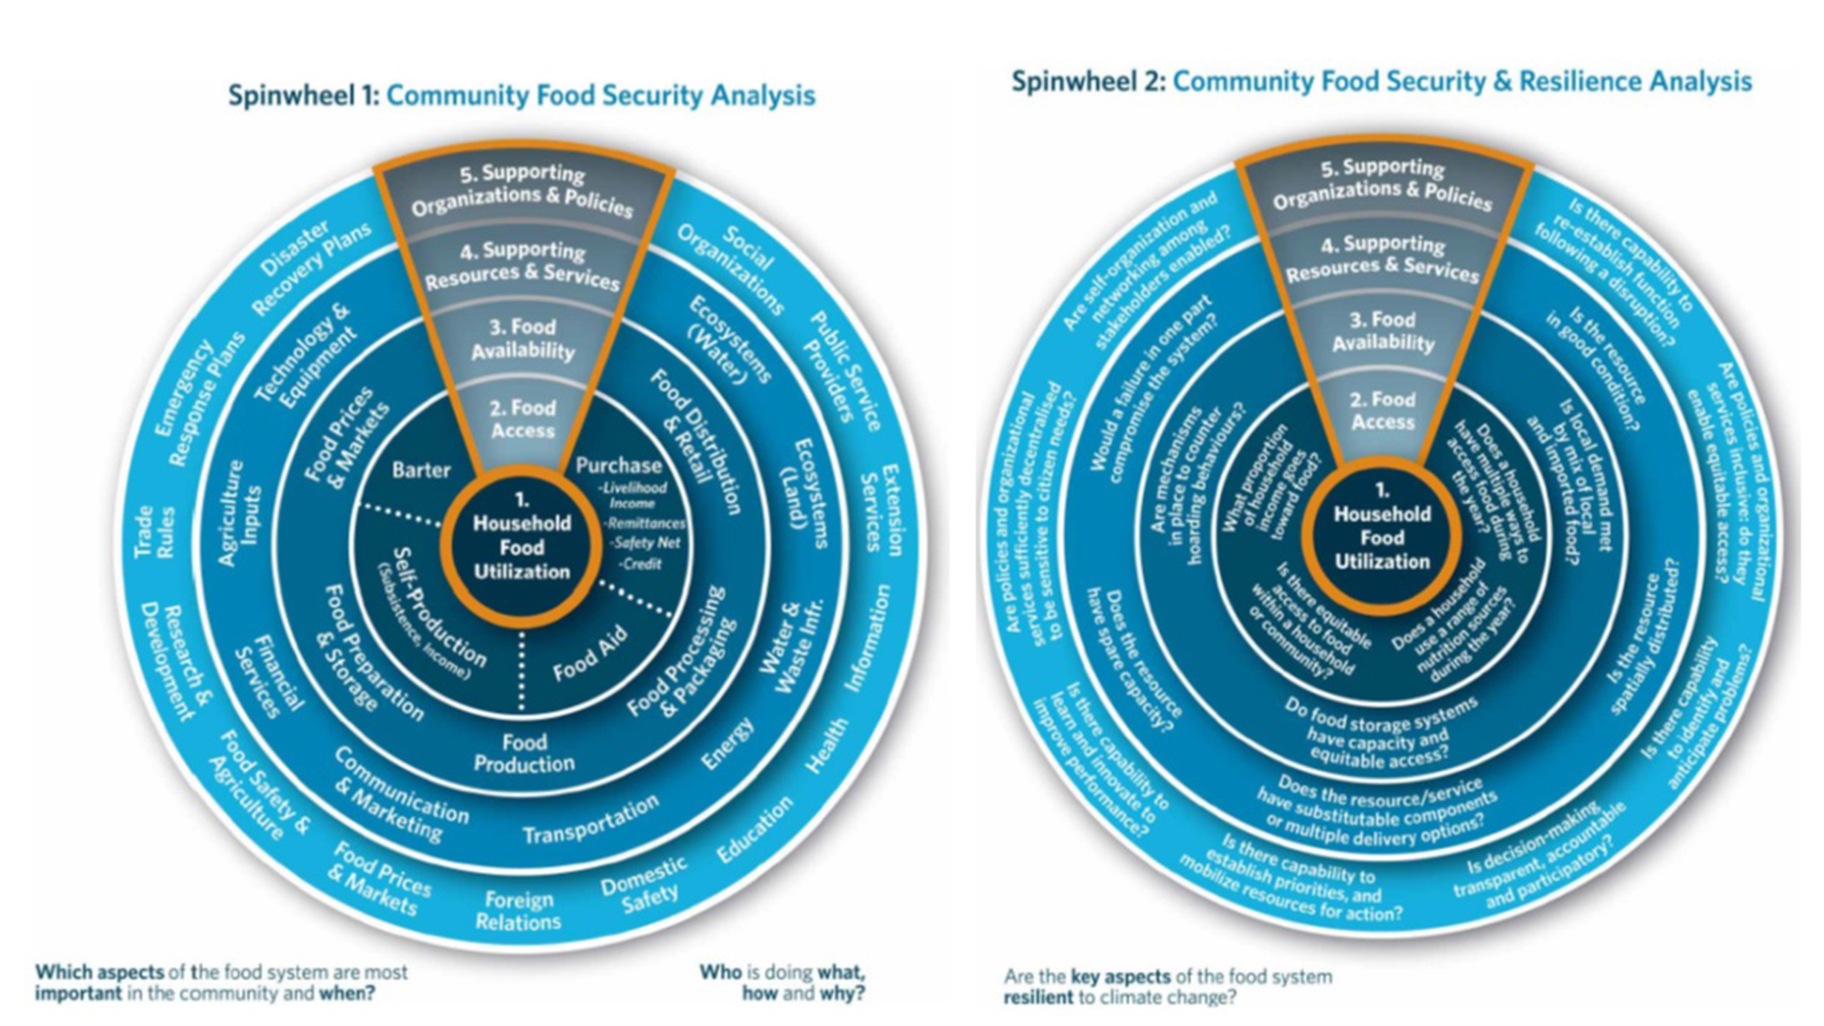
Food systems can be represented to show linkages at (or between) several different scales: global, national, or local. The FSVs we reviewed cover all these scales, although some were not specific to any particular scale. The unscaled FSVs were presented in a generic form intended to be adjustable to a specific application. The intended scale was not specified in one third of our sample FSVs. For the rest, the most common visualizations represented global-to-household or national-to-household levels. By connecting households to higher-level drivers, users can better understand the factors influencing household food security and how they are connected. By showing these linkages right down to the level of the household or individual, they help to illustrate the impacts of policy and governance choices or food production systems on nutrition and food security. Some of the FSVs are framed at other scales, like landscapes and ecosystems, to represent the importance of the natural environment on food systems and outcomes.
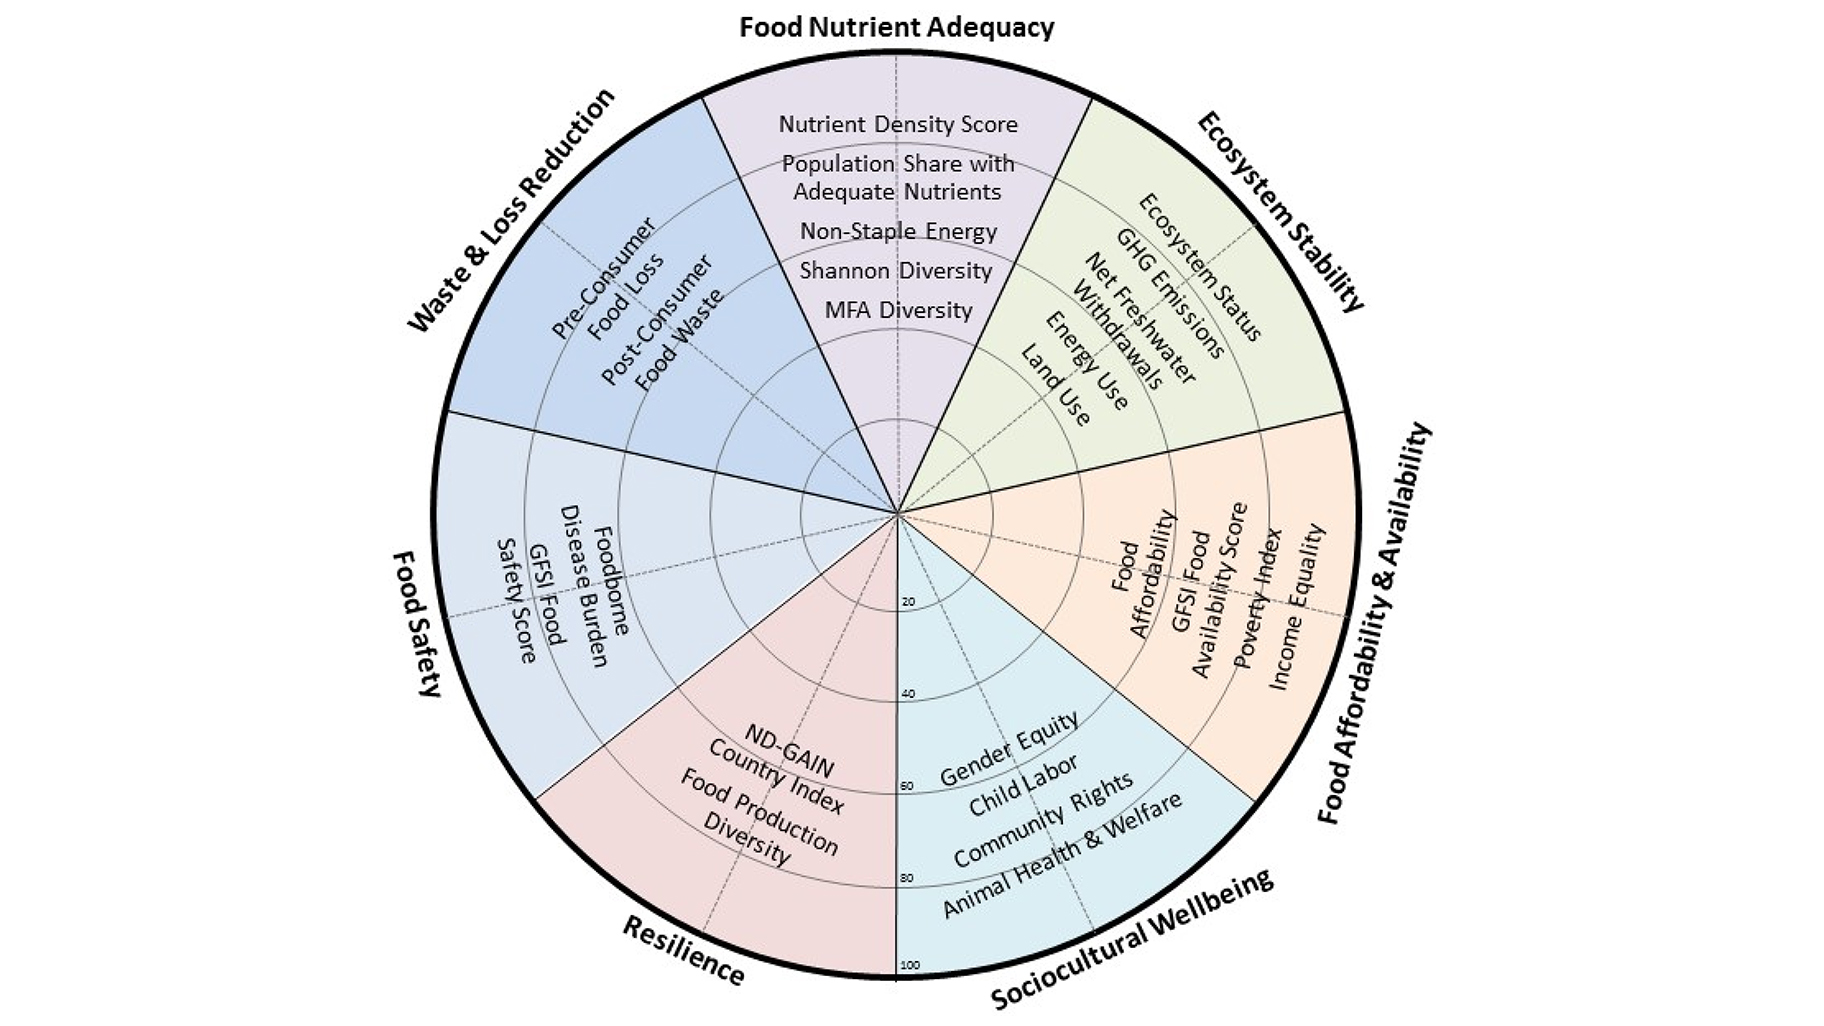
Figure 2. The most listed components of the food systems in the analyzed FSVs
Examples of reviewed FSVs illustrating different scales

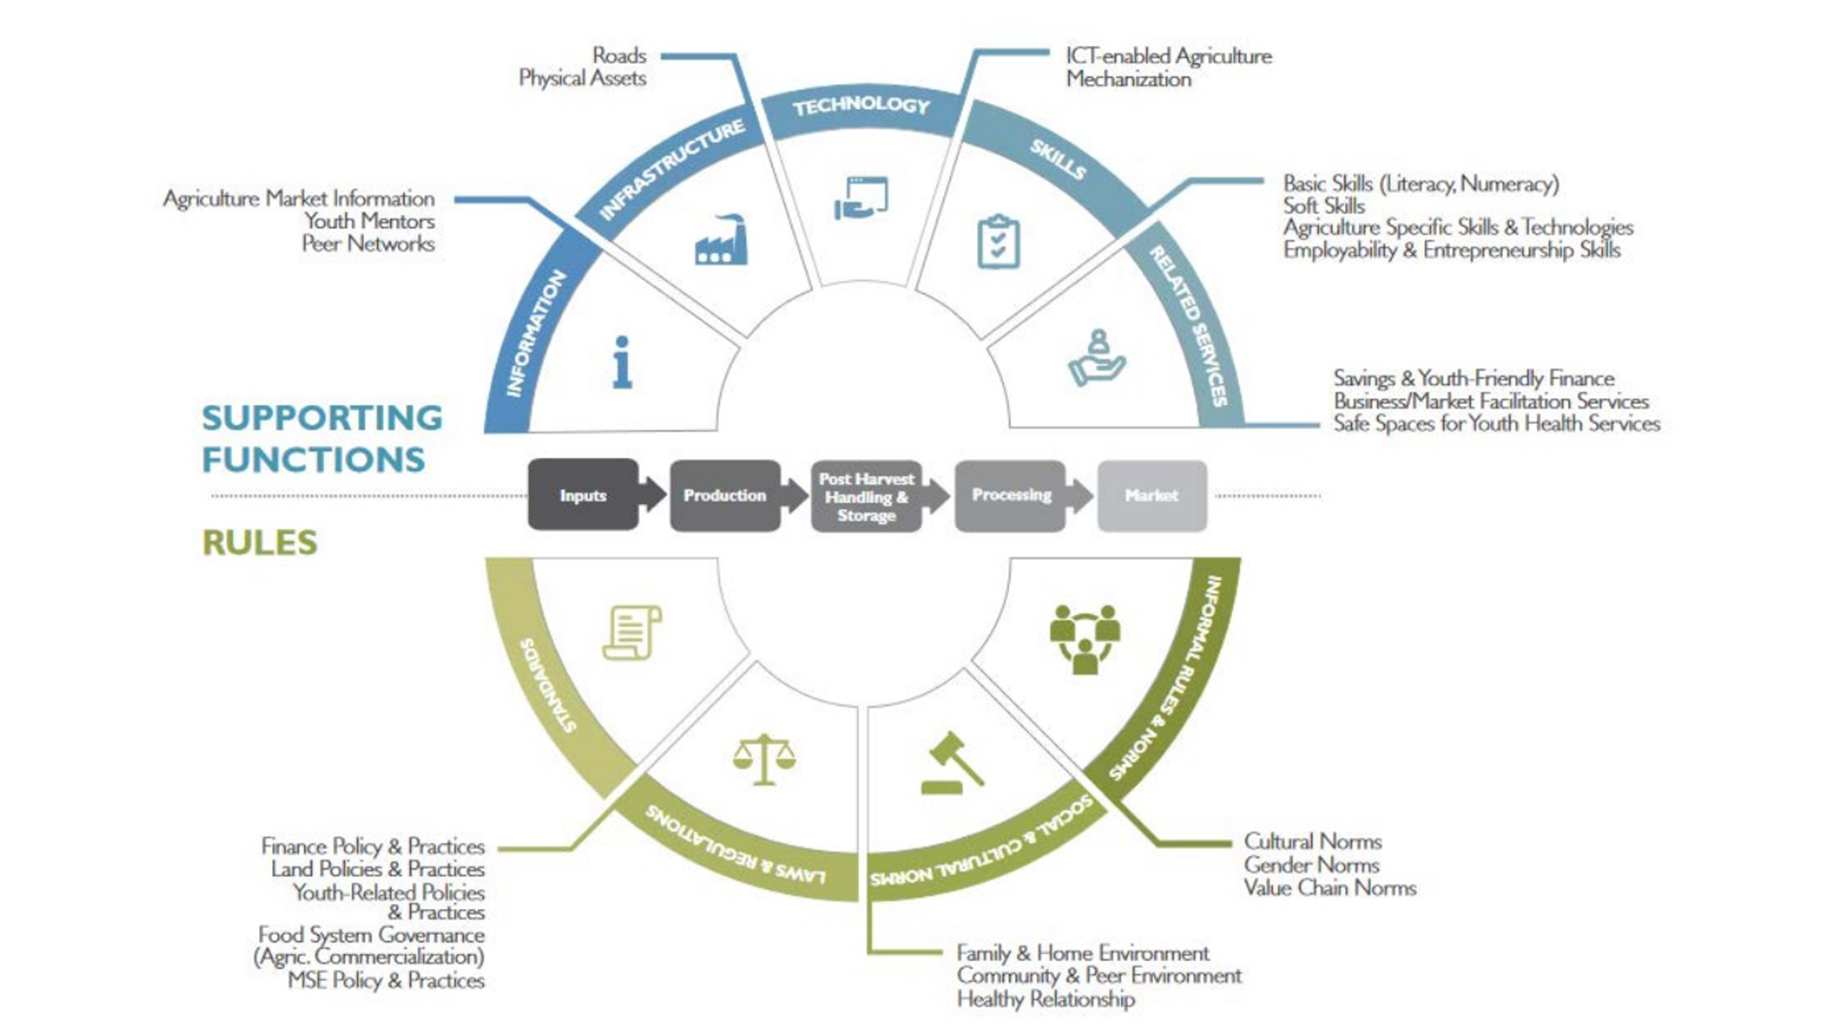
Visual Style
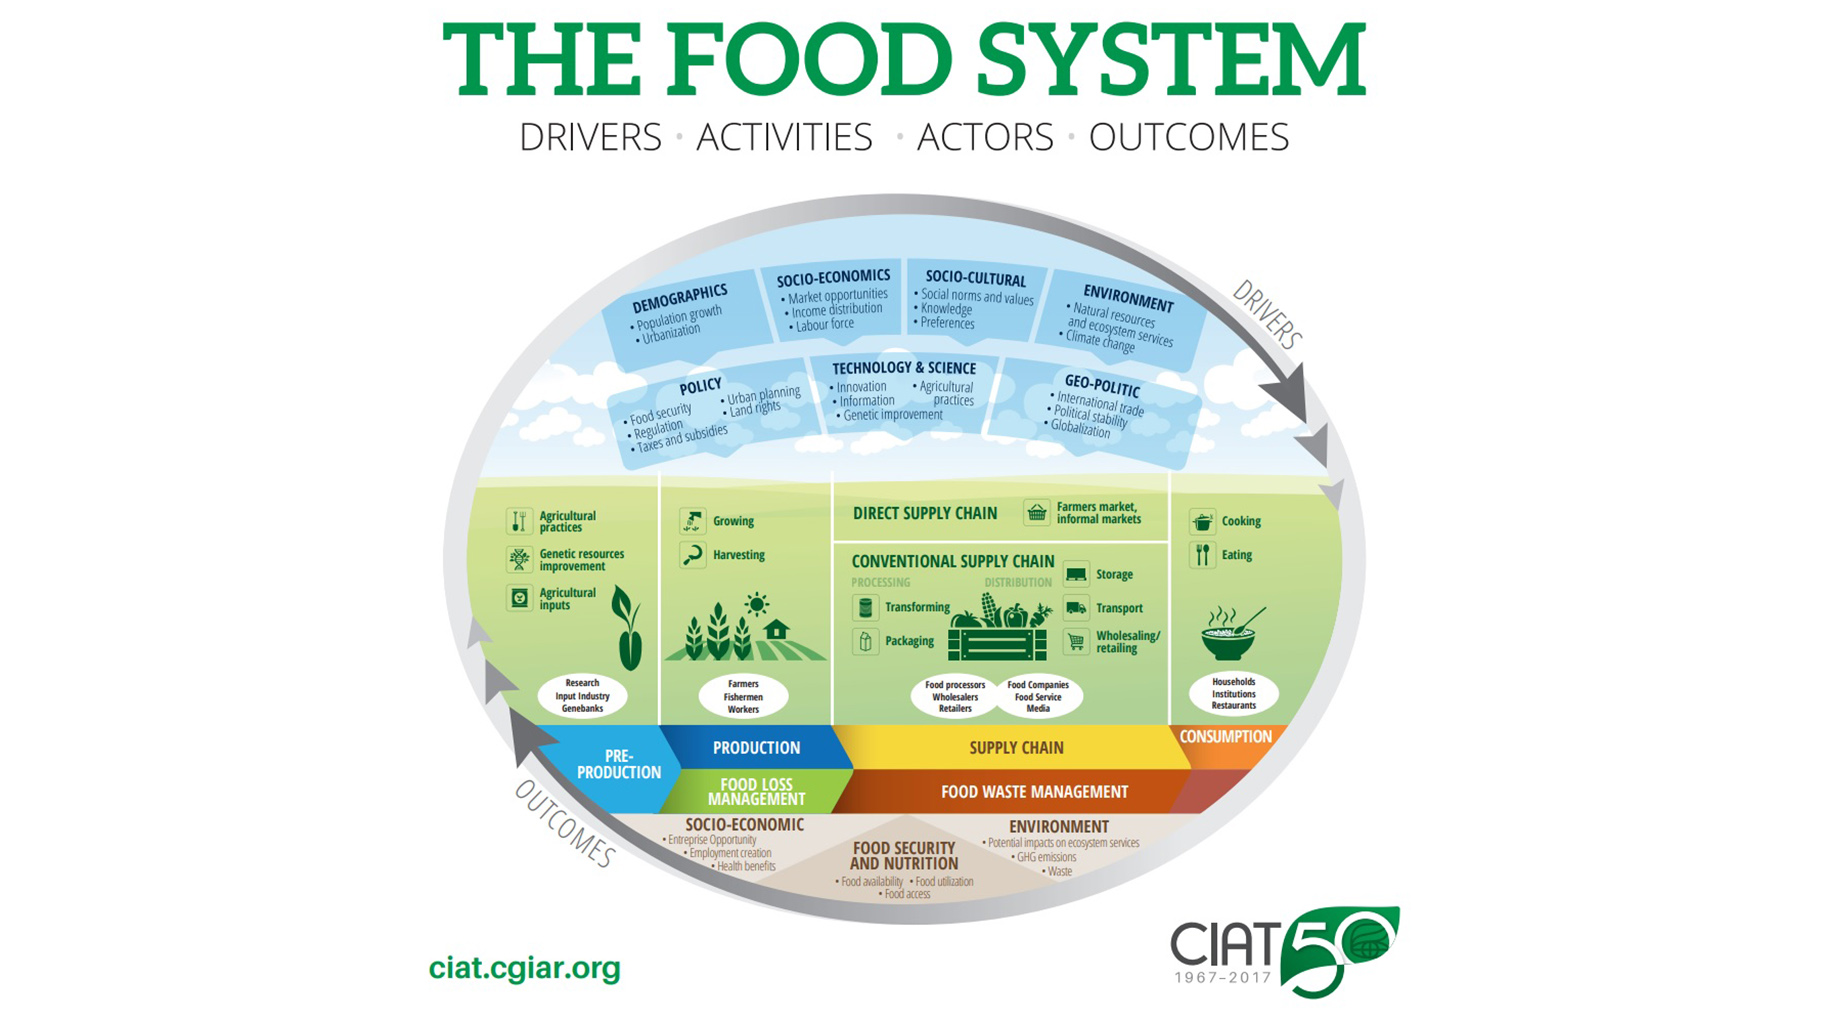
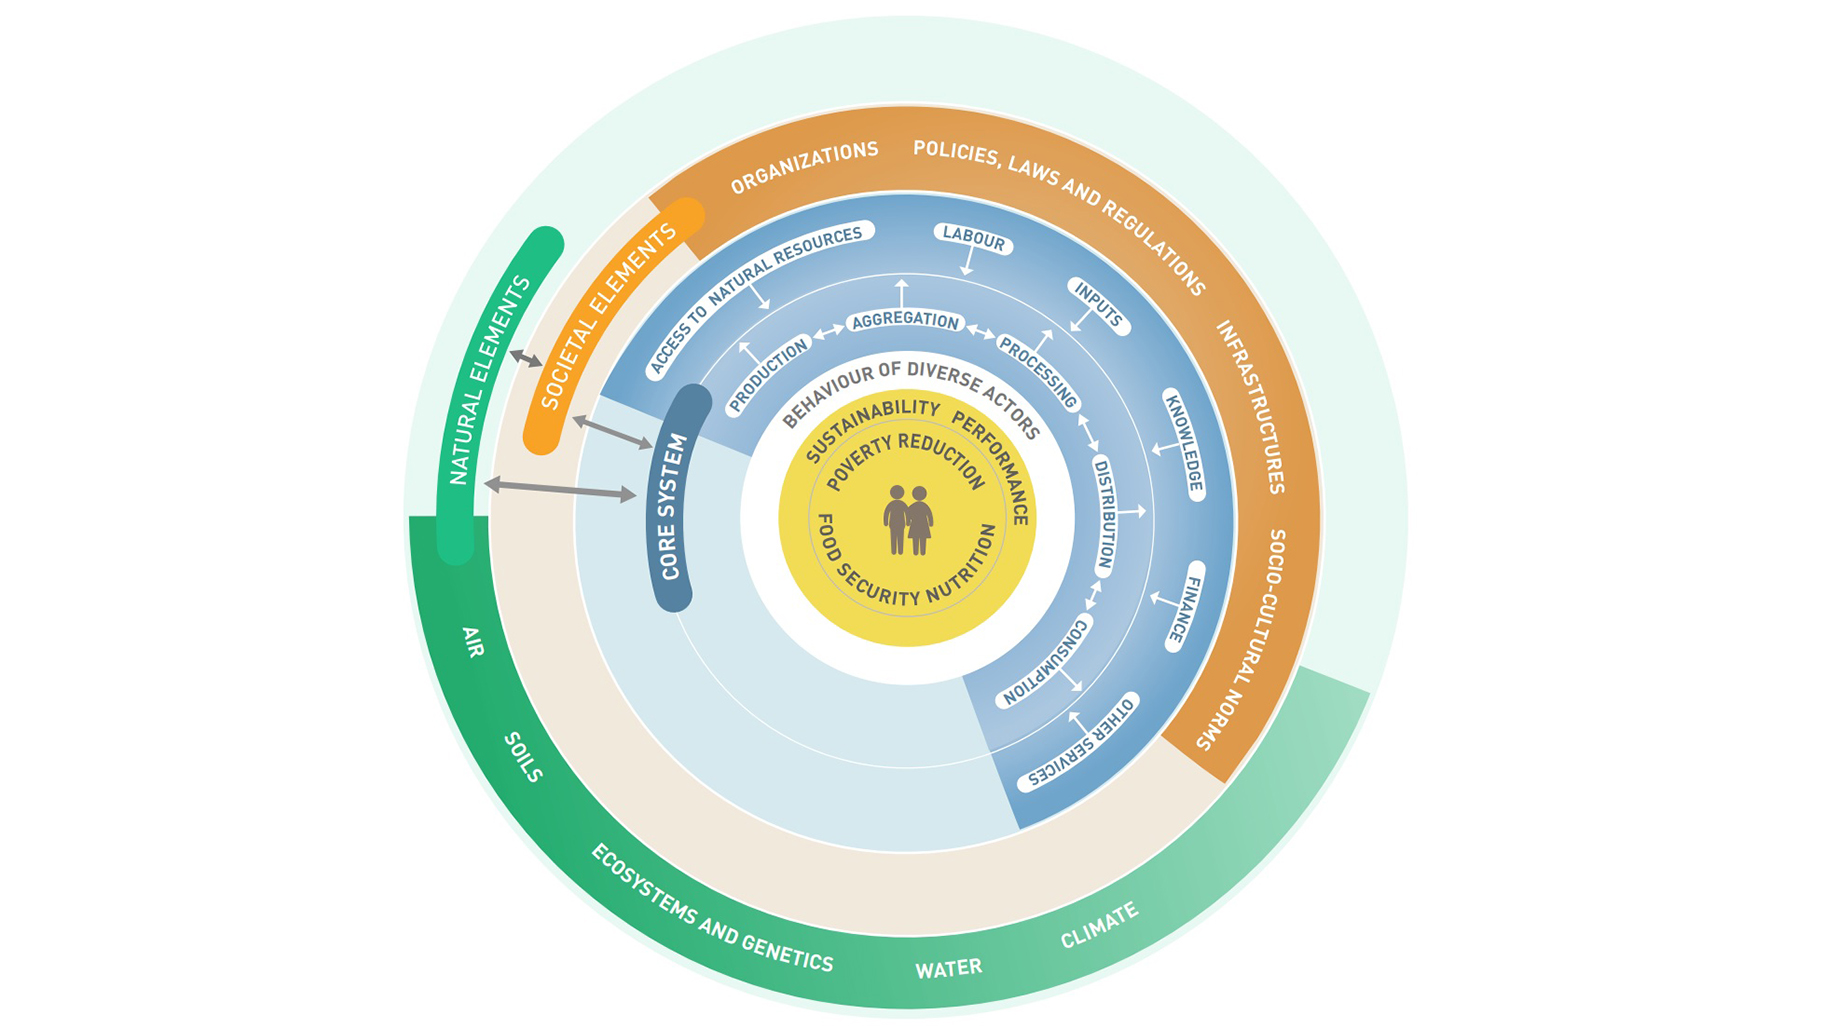
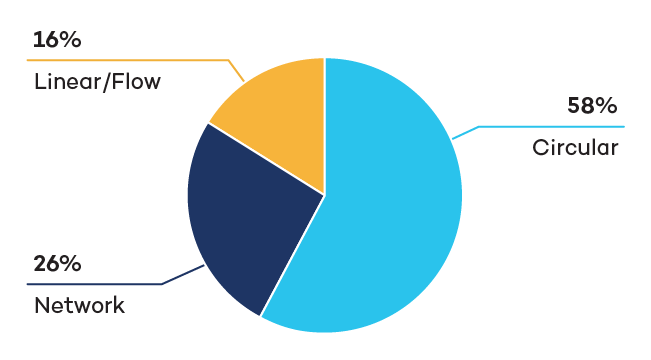
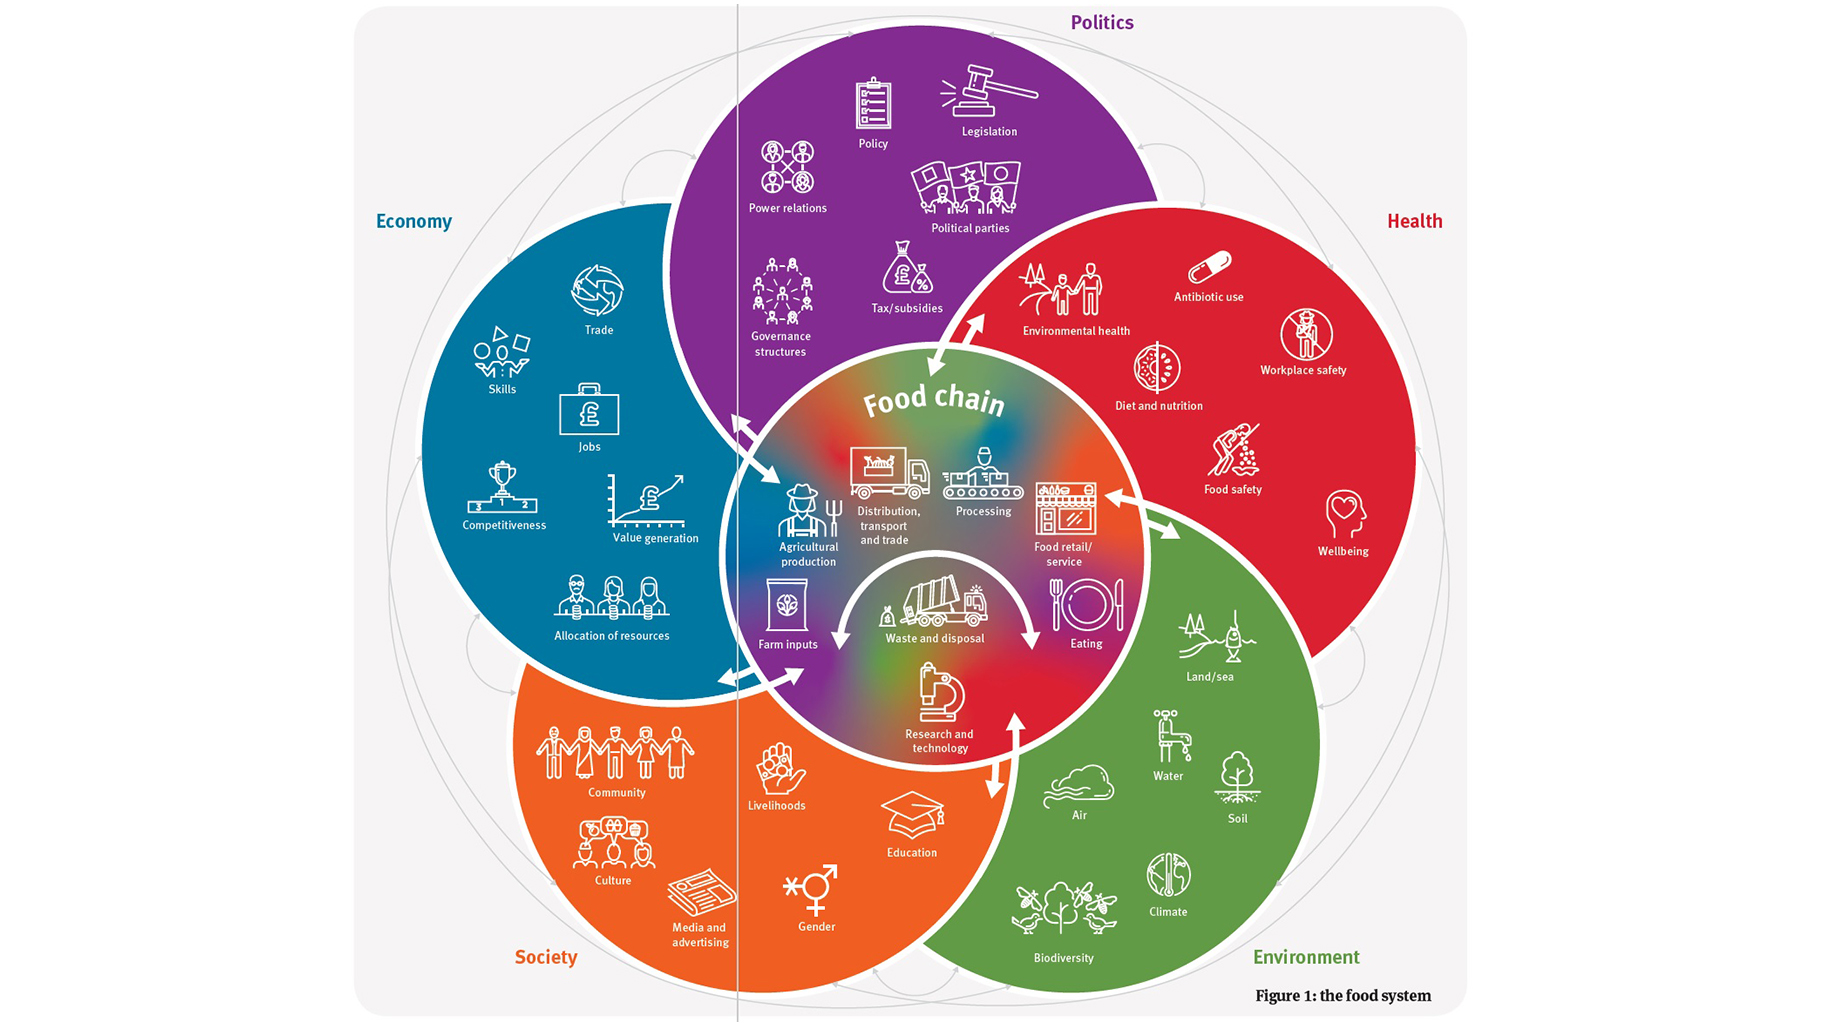
Overall, the representations of food systems can be grouped into three main types. One type represents food systems visually through a set of concentric circles or partial circles that are nested or overlapping. In this visualization, drivers such as governance and policy are typically shown in the outer circles and nutrition and household food security aspects within the inner circle. The second type of visualization connects different components of food systems by arrows and linkages, creating a web or network of linked components and feedback loops to connect drivers, production systems, and outcomes. The final type of representation for food systems is a flow or linear diagram. This type highlights the linear flows between system components. FSVs using this type of visual often have a sectoral focus and are mostly concerned with food production, processing, and sale rather than policies or nutritional outcomes.
Figure 3. Different types of FSVs by visual presentation
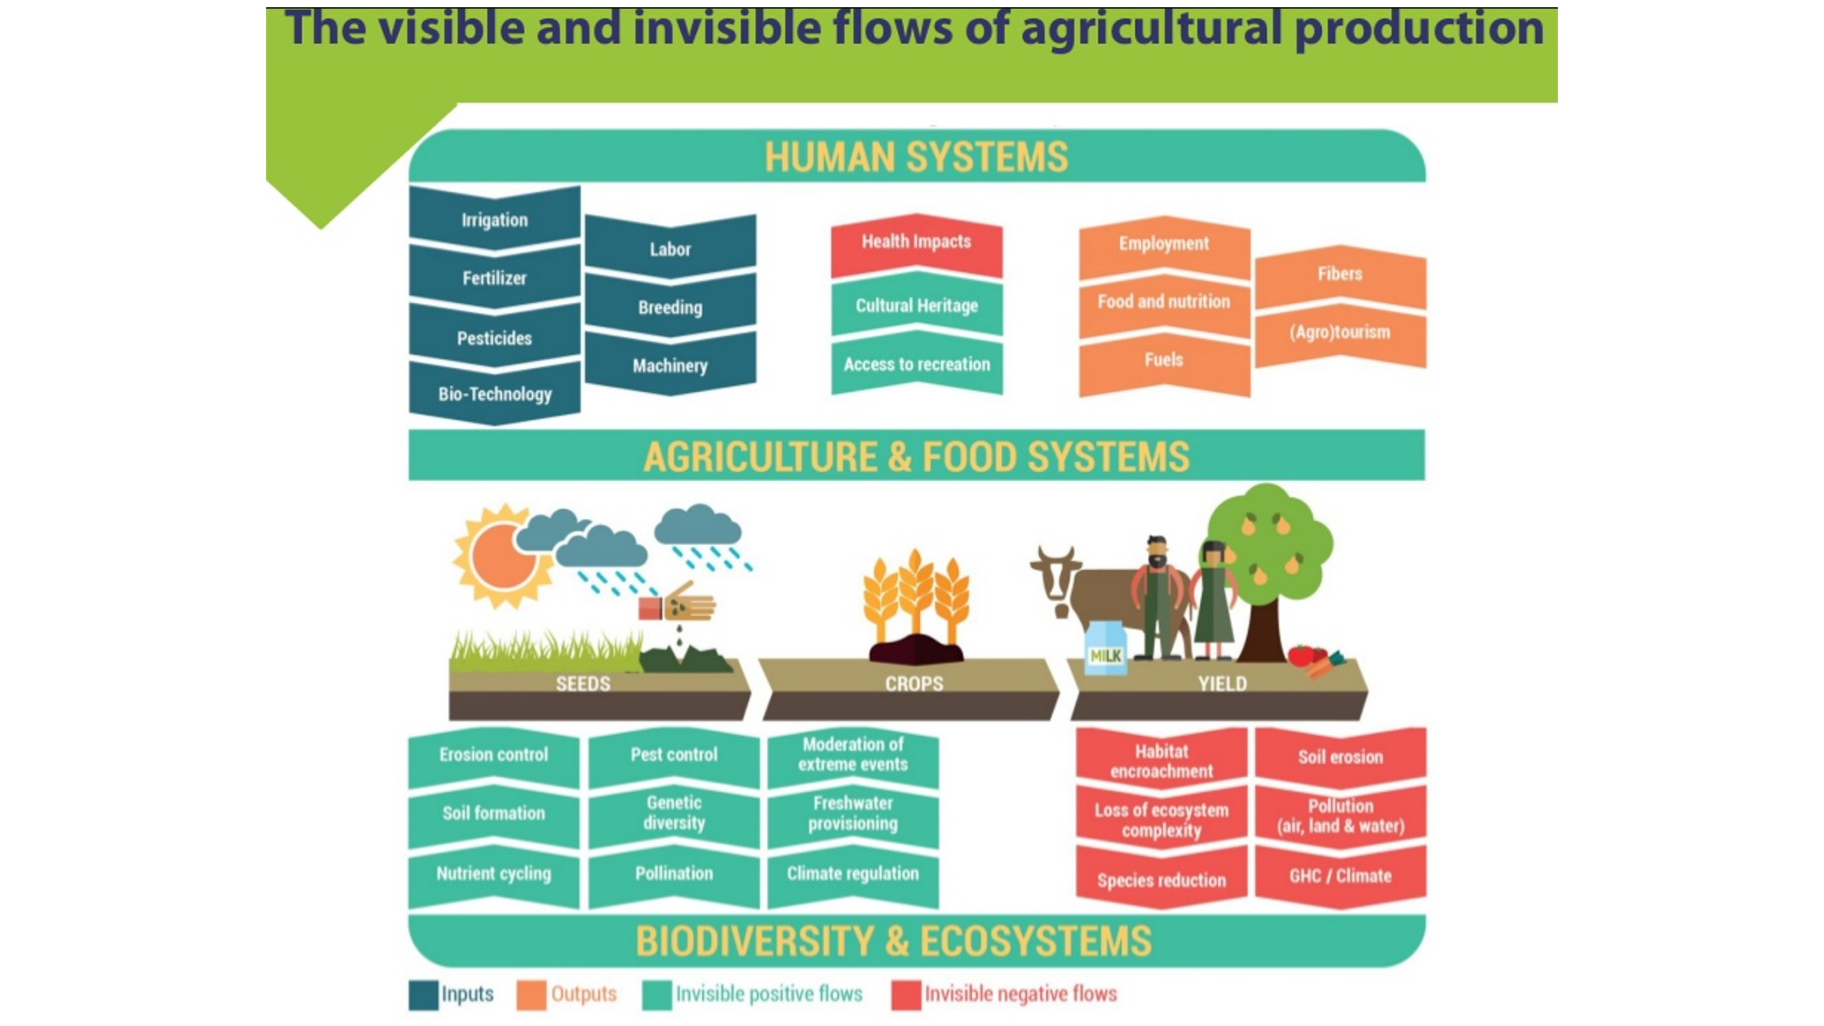
Examples from the FSVs

SDGs and Food System Resilience
Most of these FSVs were developed prior to the adoption of the SDGs. We analyzed them to see how well they covered different aspects of SDG 2 (zero hunger). We considered whether the FSVs addressed targets of food security (SDG 2.1), nutrition (SDG 2.2), income and productivity (SDG 2.3), or linkages between agricultural production and environment (SDG 2.4). The FSVs were grouped into four categories based on how many of these issues were addressed. Just under one fifth of them cover all four SDG 2 targets, but about the same share did not cover any of these SDG 2 targets.
In terms of resilience, only 16% of FSVs and related publications specifically addressed resilience in food systems. The issue was discussed in terms of ensuring food security, the resilience of related environmental systems, and the resilience of value chains. Specifically, some of the FSVs emphasize the importance of ensuring resilience in food access and inclusiveness as well as food safety under a range of anticipated operational disruptions. There is also some discussion of the role of environmental systems in promoting resilience to climate change and ensuring ecosystem stability. Resilient food system value chains are assessed in relation to potential disruptions to supply linkages, trade, and agricultural production systems.
Figure 4. The analyzed FVS covering critical areas for SDG 2 targets (2.1, 2.2, 2.3, 2.4)
Examples of relevance for SDGs and Resilience


Key Findings
The FSVs we reviewed cover a range of perspectives on food systems to address different analytical objectives, bring together inputs and outcomes, and represent diverse components of these systems. They are mostly centred on agricultural production and value chains, environmental aspects and their linkages to household and personal food security, and nutritional challenges. The primary focus of these FSVs is to understand and explain the various food system components and connections. In this context, governance and policy parameters were not usually the main subjects of analysis, but these issues are often listed as key factors affecting food system outcomes. More topical issues, such as SDGs and resilient features, have emerged in recent FSVs, and it can be expected that such issues will gain prominence in the food system visuals developed in the near future.
To view the full list of FSVs, see the reference list.
You might also be interested in
From Subsidies to Sustainability
Examining how agricultural subsidy reform across sub-Saharan African countries can promote soil health, equity, climate resilience, and sustainability.
Over a Decade of Protecting the World's Fresh Water: Five ways IISD Experimental Lakes Area has made a difference
The Experimental Lakes Area has been transformed ever since IISD saved it from imminent closure. But, don’t just take our word for it. Here are five stories from people who have seen, firsthand, the impact of IISD-ELA over the last decade.
World Trade Organization Talks on Additional Fisheries Subsidy Rules
World governments are currently negotiating additional global disciplines to curb harmful fisheries subsidies. What new rules are being proposed?
Market Trends and Potential Benefits of Eco-Certification to Inform Manitoba Commercial Fisheries
Several commercial fisheries in Manitoba are currently considering eco-certification, but questions remain among fishers about the consumer side of the market for eco-certified fish. This report addresses the current market trends in eco-certified fish in the United States and Europe and makes recommendations for how to best relay this important information to fishers.