More Winnipeggers Walk or Bike to Work than National Average
Two events are celebrating active transportation in Winnipeg this June - the Commuter Challenge takes place June 5-11 as part of Canadian Environment Week, and Bike Week Winnipeg takes place June 18-24.
What does Peg tell us about active transportation trends in Winnipeg compared to the rest of Canada?
Peg tells us…
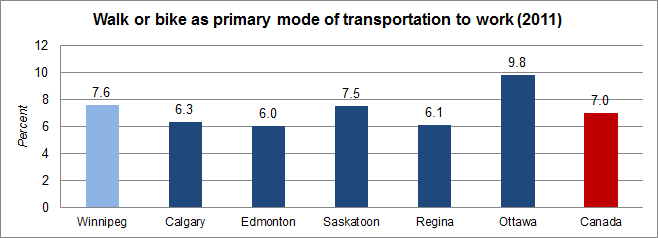
Between 2001 and 2011, the percentage of Winnipeggers walking or biking to work as their primary mode of transportation has decreased slightly, from 7.9% in 2001 to 7.6% in 2011. The national rate is 7.0%
The facts are:
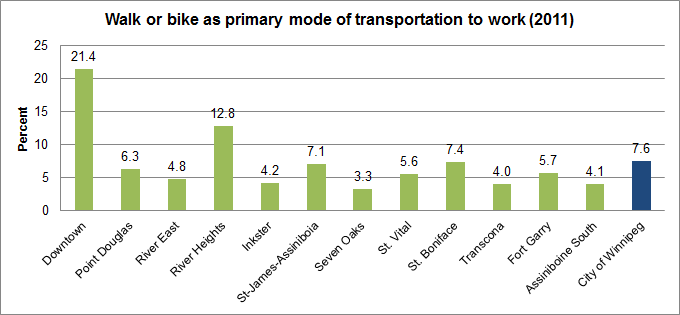
- 21.4% of downtown residents walk or bike to work as their primary mode of transportation, compared to 7.6% of Winnipeggers overall.
- Across Canada, the rates for similarly sized cities include 9.8% in Ottawa, 6.0% in Edmonton, and 7.5% in Saskatoon.
Why does this matter?
- Active transportation is being increasingly embraced by cities as a transportation mode that provides multiple benefits, including improved citizen health, decreased road damage, better air quality, decreased costs to commuters, increased social interactions and even higher property values (City of Winnipeg, 2011).
Definitions:
- The active transportation indicator shows the percentage of people who walk or bicycle as their primary mode of transportation to work.
- This indicator does not take into account individual variation in the mode of transportation taken to work. For example, someone who drives a car to work 60 per cent of the time and bicycles 40 per cent of the time would only be recorded as using a car.
- This indicator does not count outings not related to work, and does not take into account differences in distance.
- *More detail and source data for the above facts available at http://www.mypeg.ca/explorer/WellBeing/NaturalEnvironment/ActiveTransportation/
Source of the data:
- Peg’s data for the Active Transportation indicator is provided by Statistics Canada.
- Peg creates short videos to illustrate data in a different way. Here are two stories featuring two Winnipeggers’ transportation choices:
Media inquiries:
For interviews on Peg, the data, or to be connected with organizations making a difference in the community, please contact:
Sumeep Bath, Media and Communications Officer
International Institute for Sustainable Development (IISD)
(204) 958-7740 | [email protected]
About us:
Peg (mypeg.ca) is a community indicator system that measures the health of our community year over year – in ways that count. Peg is led by two partnering organizations – the International Institute of Sustainable Development (IISD) and United Way of Winnipeg (UW).
Regularly, the team at Peg releases data and facts that help us understand our city better. This is one of those regular reports. Others can be found at http://www.mypeg.ca/blog.
Peg is the starting place for Winnipeg citizens, educators, policy makers, and many others to learn more about our city so we can lead change to create a better city for our children and their children. At Peg we can all learn how our lives, our neighbourhood and our city is changing – for the good and the bad. Learn more at www.mypeg.ca.
About IISD
The International Institute for Sustainable Development (IISD) is a globally recognized think tank with 3 decades of experience working to solve the world’s most pressing sustainable development challenges. We combine deep expertise in a wide range of issues with a collaborative approach to research, policy advice, and hands-on support to ensure these solutions are brought to life. Headquartered in Winnipeg, Manitoba, we are a diverse team of over 300 professionals working from offices in Canada, Switzerland, and other locations around the world.
You might also be interested in
Stalemate on the Global Goal on Adaptation in Bonn: What it means
Countries couldn’t reach an agreement on the Global Goal on Adaptation, but it doesn't change the need for them to track and assess their efforts.
A Measure of Care
As countries consider how to move beyond GDP in better measuring prosperity, this report explores how to ensure the unpaid labour of women is counted.
State of Global Environmental Governance 2025
Analysis of the wins and setbacks in international environmental negotiations in 2025 amid unprecedented challenges to multilateralism.
IISD’s Best of 2025: Publications
As 2025 draws to a close, we’re revisiting our most downloaded publications of the year.