The Scope of this SAVi Assessment
In 2017, the Dutch Ministry of Infrastructure and Environment (Rijkswaterstaat) requested that IISD use SAVi to:
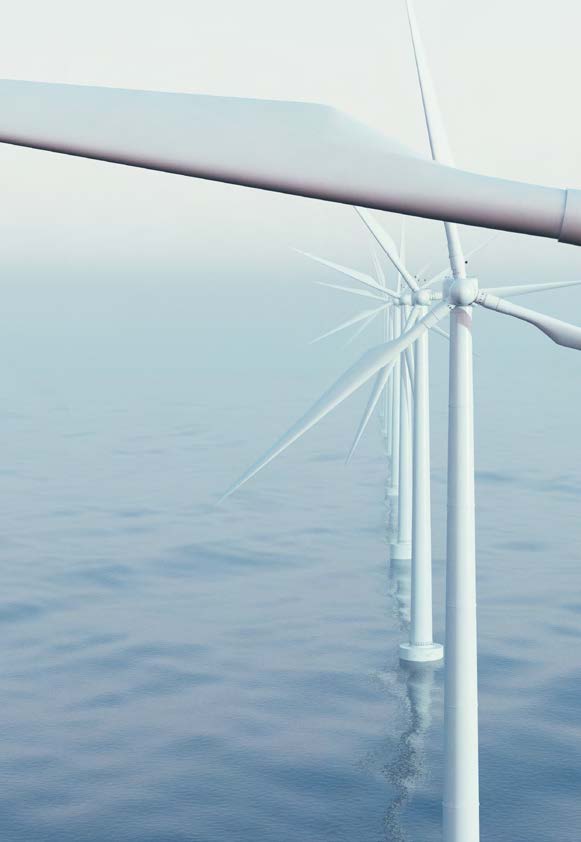
- Compare the financial attractiveness of the planned 9.5 gigawatt (GW) offshore wind farm in the North Sea with other technologies. In this summary, we provide the comparison between the offshore wind farm and a coal energy plant that generates the same capacity of 9.5 GW. The comparison with other technologies is available on request.
- Assess the cost of physical and transitional climate risks
- Value, in financial terms, a range of material externalities
Risks
Rijkswaterstaat identified the following climate risks to energy infrastructure:

Physical Risk
An increase in temperature by 1.5°C.
SAVi calculated to what extent this increase in temperature affects the performance of energy infrastructure. An increase in temperature decreases the energy efficiency of a coal power plant and makes wind energy, in comparison, more performant.

Transitional Risk
Imposition of a carbon tax of EUR 16.27/MWh throughout the operation of the asset.
SAVi calculates the impact of this tax on energy infrastructure. The carbon tax negatively affects the performance of a coal power plant.

Emissions
Valuations of carbon dioxide, particulate matter, sulfur dioxide and nitrogen oxide emissions based on their related health costs. For clean energy solutions such as the wind farm, this will result in an avoided health cost compared to coal.

Labour income
Valuation of income spending from additional employment created for construction and operations of the energy infrastructure. This is based on average income per worker and share of discretionary income spent in the Netherlands.

Land use
Valuation of benefits of retaining land for agriculture instead of power generation on land. This opportunity cost is calculated based on productivity per hectare of agriculture land and the land required for an onshore wind farm to generate 9.5 GW of electricity.

Loss of fisheries
Revenues lost for the fishing industry, as the wind turbines are located offshore.

Sand mining
Whether the construction of wind farms will constrain the ability to harvest sand.

Recreation
Changes in revenues from tourism and recreation measured by changes in real estate prices in Ijmuiden and the surrounding coastal areas.

Seaweed
The farming of seaweed in between the wind turbines developing into a new industry.
Summary of the SAVi Analysis
The SAVi analysis compared the financial performance of the offshore wind farm to a coal power plant that generates the same output of 9.5 GW. The analysis of each of the two assets is organized under the following four scenarios:

Scenario 1: Business-as-Usual (BAU)
Under the BAU scenario, coal emerged as the most profitable technology. It has a lower levelized cost of electricity, higher internal rate of return and a more attractive debt service coverage ratio and loan life coverage ratio.

Scenario 2: The SAVi+ Scenario: BAU and the value of the externalities
When correcting the

Scenario 3: The SAVi+ Scenario and the physical climate risk
Adding the impacts of a higher temperature, offshore wind came out as the clear winner with an IRR at a steady 17 per cent, while coal fell to 0 per cent.

Scenario 4: The SAVi+ Scenario and the physical and transitional climate risk
When adding in a carbon tax,
SAVi estimates that the offshore wind project will create 2,780 jobs (estimated in full-time equivalents)
Rijkswaterstaat requested that we use SAVi to calculate the carbon emissions of different energy technologies. We calculated emissions across the asset life cycle, which includes fuel use during the manufacturing and installation of the power capacity. The emissions of coal- and gas-powered generations are significantly higher than for any other renewable option.
SAVi analysis on the carbon emissions of different energy technologies (in million tonnes)
| Scenarios | Wind (off) | Coal | Gas | Nuclear | Biomass | Hydro | Solar | Wind (on) |
| CO2 Emissions – fuel | – | 1,652.0 | 731.6 | – | – | – | – | – |
| CO2 Emissions – life cycle | 19.6 | 1661.5 | 745.1 | 7.1 | 8.2 | 4.7 | 56.2 | 31.4 |
SAVi analysis on the levelized cost of electricity (LCOE) (in EUR/MWh)
| Scenarios | Offshore wind | Coal |
| Scenario 1: BAU | 72.93 | 46.08 |
| Scenario 2: SAVi+* | 65.22 | 171.77 |
| Scenario 3: SAVI+* and physical climate risk | 65.22 | 171.77 |
| Scenario 4: SAVI+* and physical and transitional climate risks | 65.22 | 185.92 |
The LCOE is the net present value of the unit cost of electricity over the lifetime of the asset. It is considered to be a proxy for the average price that an energy-generating asset must receive to break even over its lifetime.
- When externalities are not considered, coal appears to have the lowest LCOE with EUR 46 per MWh. This is mainly because the offshore wind project has larger capital costs, and this increases the cost of financing.
- When the LCOE is corrected for the externalities, the LCOE for offshore wind decreases to EUR 65 per MWh and coal increases to EUR 171 per MWh.
- When climate risks are taken into account, the LCOE for coal increases even further to EUR 186 per MWh. The LCOE for offshore wind remains stable at EUR 65 per MWh.
SAVi analysis on IRR
| Scenarios | Offshore wind | Coal | Difference |
| Scenario 1: BAU | 14.39% | 23.43% | – 9.04% |
| Scenario 2: SAVi+* | 16.61% | 3.89% | + 12.71% |
| Scenario 3: SAVi+* and physical climate risk | 16.61% | 3.85% | + 12.76% |
| Scenario 4: SAVi+* and physical and transitional climate risks | 16.61% | 0% | + 16.61% |
Equity IRR is an indicator for the profitability prospects of a potential investment. The IRR is the discount rate that makes the net present value of all cash flows from a particular project equal to zero. Cash flows net of financing gives us the equity IRR.
- The IRR for the offshore wind project is over 12 per cent higher than the IRR for the coal plant when we consider the value of the positive and negative externalities.
- When climate risks are considered, the difference in IRR increases to more than 16 per cent, and the IRR of the coal plant falls to close to zero.
SAVi analysis on the minimum debt service coverage ratio (DSCR)
| Scenarios | Offshore wind | Coal | Difference |
| Scenario 1: BAU | 1.45x | 2.75x | – 1.30x |
| Scenario 2: SAVi++* | 1.58x | 1.00x | + 0.58x |
| Scenario 3: SAVi+* and physical climate risk | 1.58x | 0.99x | + 0.59x |
| Scenario 4: SAVi+* and physical and transitional climate risks | 1.58x | 0.16x | + 1.42x |
DSCR is a measure of the cash flow available to pay current debt obligations. The ratio states net operating income as a multiple of debt obligations due within one year, including interest and principal.
- The offshore wind project demonstrates much more attractive minimum DSCR ratios than the coal plant when we consider the value of the positive and negative externalities.
- When climate risks are considered, the DSCR of the offshore wind project is 1.58x compared to 0.16x for the coal plant.
SAVi analysis on the equity net present value (NPV) (in million EUR)
| Scenarios | Offshore wind | Coal | Difference |
| Scenario 1: BAU | 5,224 | 13,119 | – 7,894 |
| Scenario 2: SAVi++* | 8,094 | – 1,851 | + 9,944 |
| Scenario 3: SAVi+* and physical climate risk | 8,094 | – 1,876 | + 9,970 |
| Scenario 4: SAVi+* and physical and transitional climate risks | 8,094 | – 3,827 | + 11,920 |
Equity NPV is the difference between the present value of cash inflows net of financing costs and the present value of cash outflows. It is used to analyze the profitability of a projected investment or project.
- The equity NPV of the offshore wind project is EUR 11,920 million higher than that of the coal plant when externalities and climate risks are accounted for.
Read the report online to learn more.